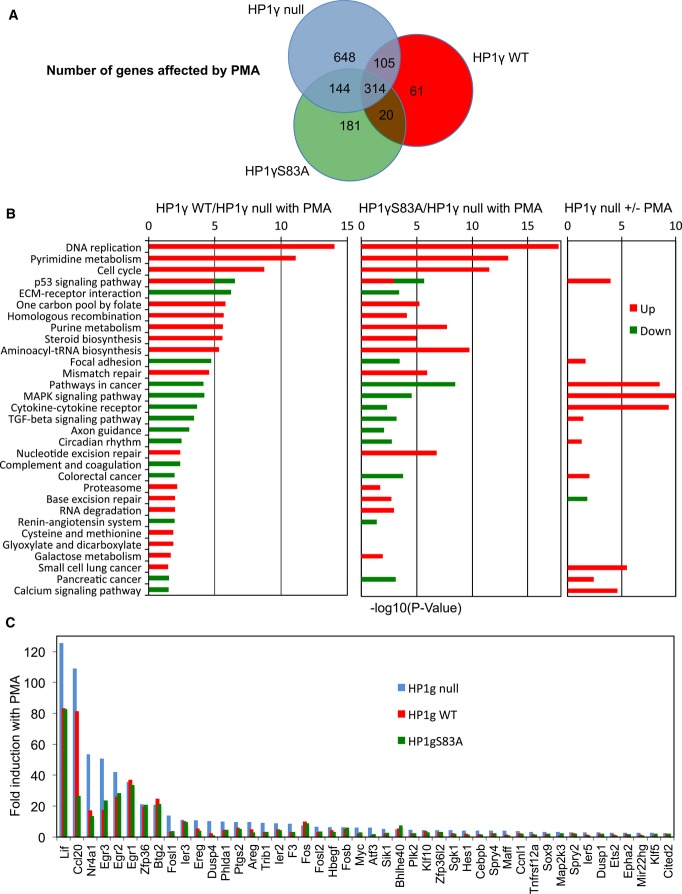
Figure 7. HP1γ affects the transcriptional impact of PMA.
- Venn diagram showing the number of transcripts regulated by PMA stimulation in HP1γ null (blue), HP1γ WT (red), and HP1γS83A (green) MEF-derived cell lines (≥ 1.5-fold change in expression, ≥ 20 reads, P < 0.05).
- KEGG functional categories significantly enriched (P < 0.05) for genes differentially expressed in the indicated conditions, depicted according to their P-value [−log10(P-value)].
- Fold induction by PMA of a subset of OspF target genes (≥ 2-fold change in expression in HP1γ null) in each of the indicated cell lines. Data and P-values are provided in Supplementary Table S1.

