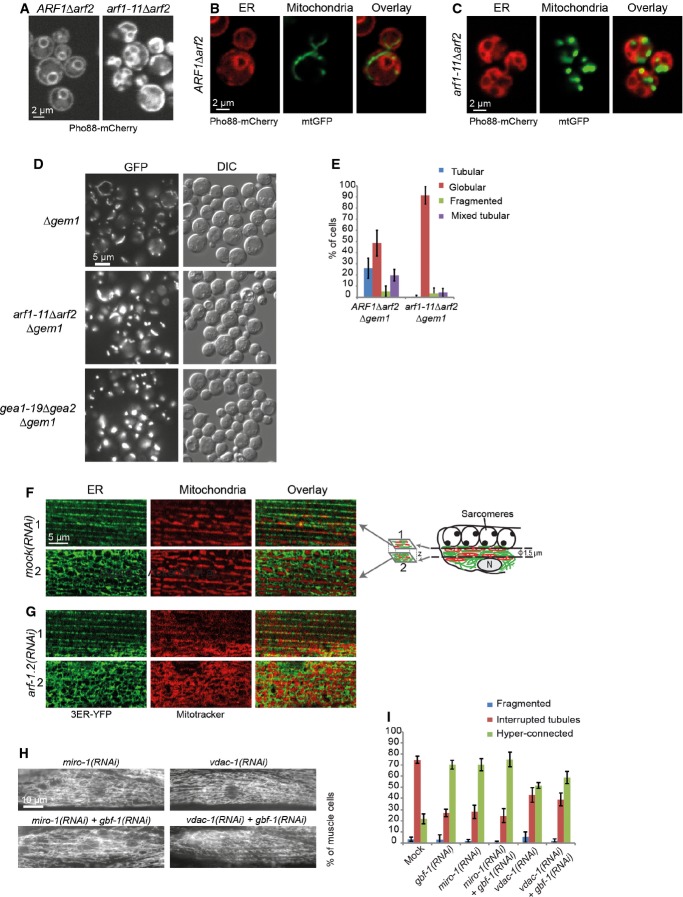
Figure 8. Analysis of ER and ER–mitochondria contact sites.
A–C The ER is affected in arf1 mutant cells. Confocal images of live yeast cells tagged with a Pho88-mCherry ER marker (A–C) and mtGFP (B, C).
D ARF1 and GEM1 interact genetically. The arf1-11Δarf2 or gea1-19Δgea2 globular phenotype is strongly enhanced by the deletion of GEM1 at 37°C.
E Quantification of the arf1-11Δarf2Δgem1 and ARF1Δarf2Δgem1 phenotypes at 37°C. For each of the three independent experiments, we scored around 100 cells per genotype. Standard deviation is given.
F, G Single confocal planes of MitoTracker and the ER marker 3ER-YFP in the muscle cells of live worms. MitoTracker is shown in red, ER–YFP in green. Two confocal planes are displayed for each strain. The first plane (indicated with “1”) corresponds to a layer flanking the sarcomeres at which the ER is organized in stripes; the second plane (indicated with “2”) is from the level of the nucleus at which the ER is organized in the characteristic reticulate structure. The positions of the confocal planes are indicated in the schematic drawing of a muscle cell on the right in (F).
H Knockdown of MIRO-1, VDAC-1, and ARF-1.2 results in a similar phenotype.
I Co-feeding with RNAi against GBF-1 and MIRO-1 or VDAC-1 did not enhance the fusion phenotype. Standard deviation is given. Mock and gbf-1(RNAi) as shown in Fig 1, miro-1(RNAi): n = 479, miro-1(RNAi) + gbf-1(RNAi): n = 398. VDAC-1(RNAi) induces a hyper-connected phenotype in 50% of the muscle cells. VDAC-1(RNAi): n = 429. Standard deviation is indicated.

