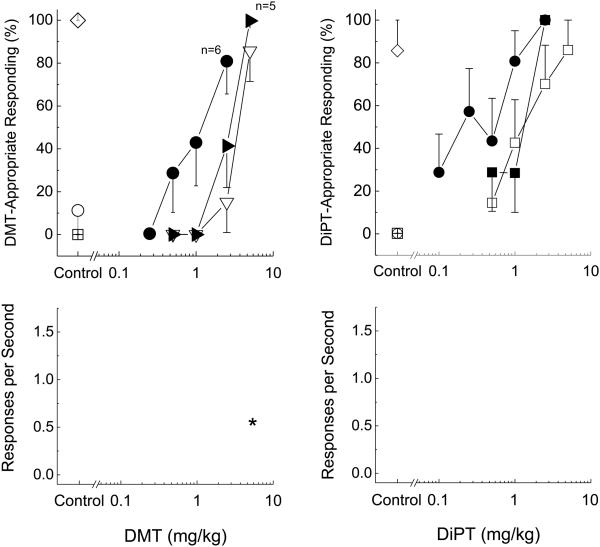
Fig. 4.
Effects of the mGlu2/3 receptor antagonist (LY341495) at facilitating the effects of DMT (left panels) and DiPT (right panels). Points represent the mean and error bars represent the standard error of the mean. Top panel shows drug-appropriate responding of the test compounds in DMT/DiPT-trained rats. The x-axis represents dose of DMT/DiPT. The y-axis represents percentage of drug-lever appropriate responding. Bottom panel shows rate of responding in responses per second (y-axis) as a function of dose. Open triangles- Dose-effect curve of DMT and DiPT; Closed triangles- 0.5 mg/kg of LY341495; Closed circles- 2.5 mg/kg LY341495. Open circles- saline control; Open diamond- drug control; open squares- LY341495 alone. N=7, except where shown. Asterisk indicates points that are different from the saline control.

