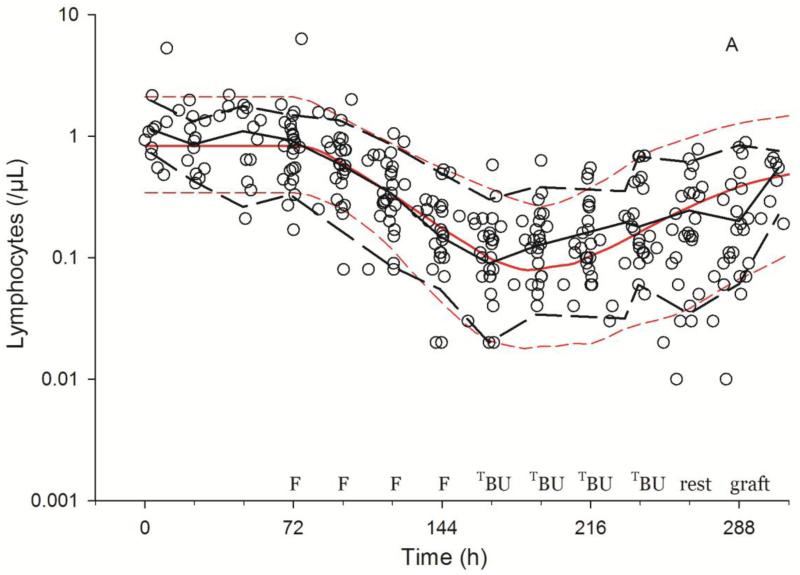
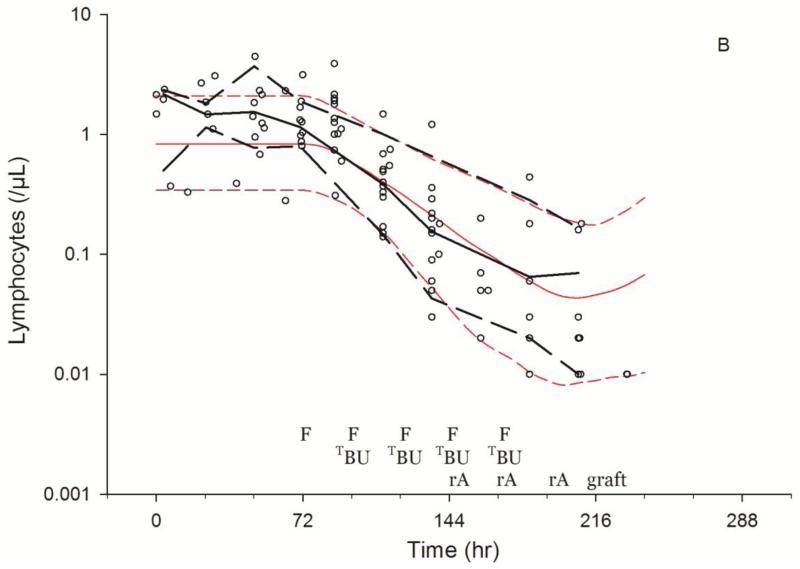
Fig. 3.
Visual predictive checks of lymphosuppression after HCT conditioning with Protocol 1519 (3A) or Protocol 2041 (3B). Black and red lines represent the median (solid) and 5th and 95th percentile (dashed) of the observed and simulated data, respectively. Start of simulations standardized to 72 hrs before fludarabine administration, showing the scheduled times of fludarabine (F), targeted busulfan (TBU), rATG (rA), rest and graft administration.


