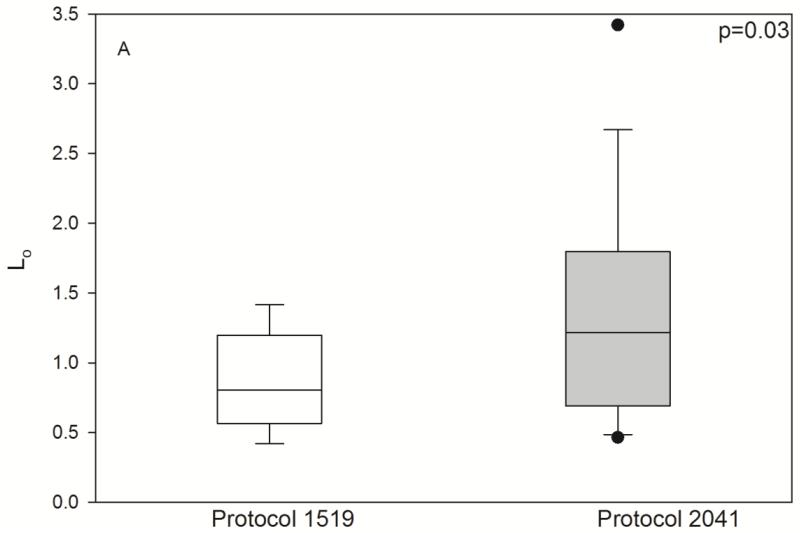
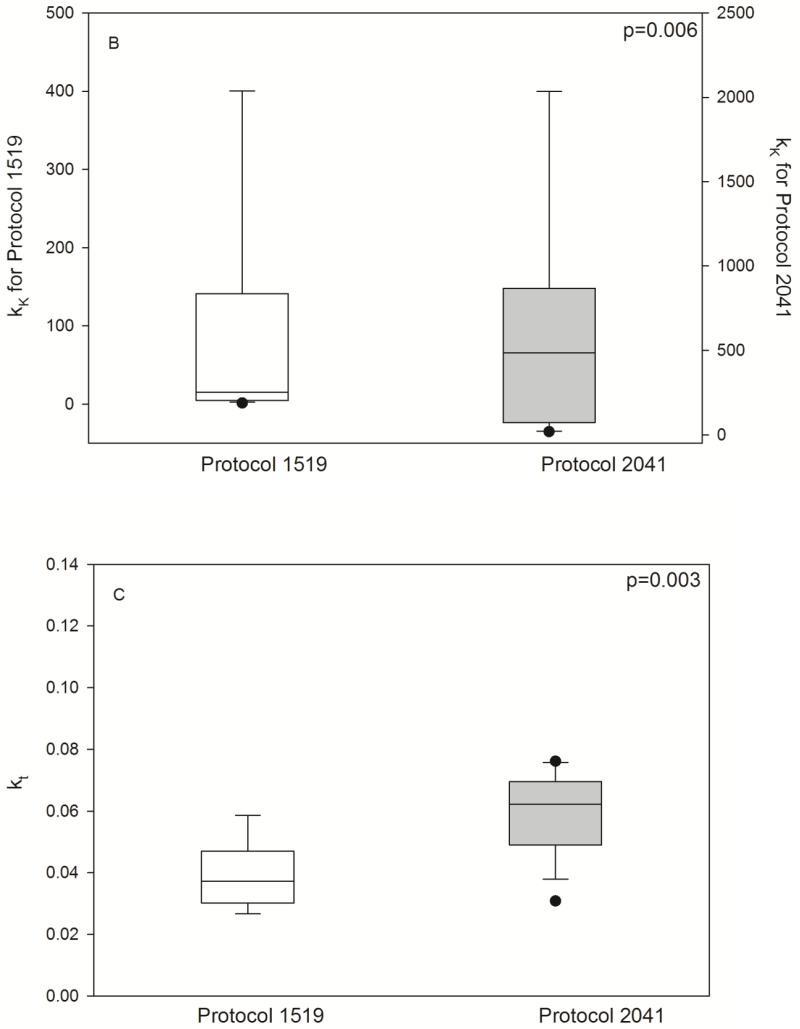
Fig. 4.
Pharmacodynamic parameters by HCT conditioning regimen. Individual posthoc parameter estimates, shown as box (interquartile range) & whisker (entire range) plot with p-values from nonparametric t-test. L0 (/μL), baseline lymphocyte count; kt (/hr), transit rate between the lymphocyte cell compartments; kK (/hr × (L/mg)), rate of lymphocyte cell kill.


