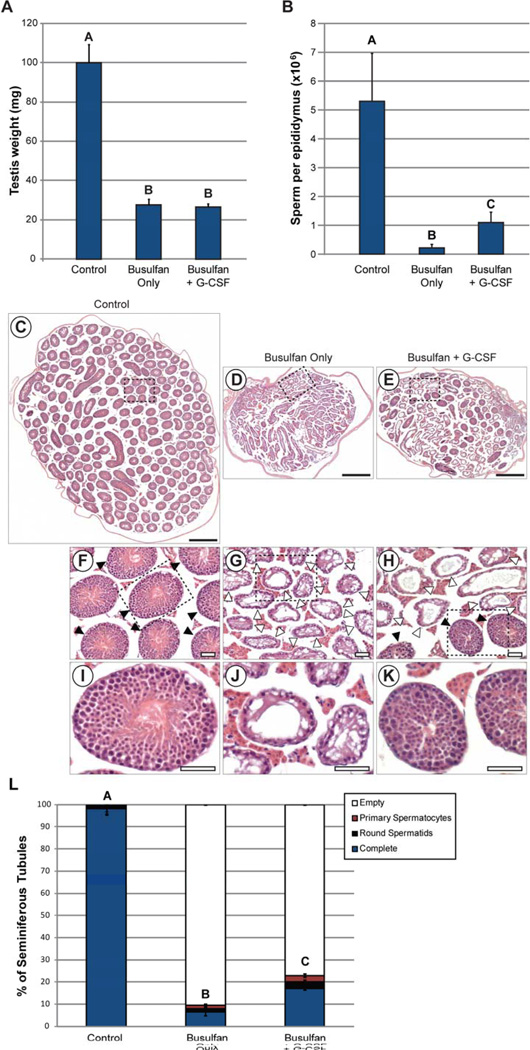
Figure 1. G-CSF prevents loss of spermatogenesis after busulfan treatment in mice.
Animals from Experiment 1 were evaluated 10 weeks after the final G-CSF/vehicle treatment (see Supplemental Figure 1). (A) Testis weight, (B) Epididymal sperm counts. Labels above bars signify statistically-significant differences between groups as determined by student’s t-test. Tiled brightfield images of H&E-stained sections of testes from (C) Control group, (D) Busulfan Only group, and (E) Busulfan + G-CSF group. Scale bars = 500µm. Enlarged images of the dashed boxes in C–E are shown in (F–H), respectively. Scale bars = 50µm. Filled arrowheads = seminiferous tubules with spermatogenesis. Open arrowheads = no spermatogenesis. Further enlarged images of dashed boxes in F–H are shown in (I–K), respectively. Scale bars = 50µm. (L) Stacked bars show the percentage of all seminiferous tubule cross-sections counted from all animals in each group which exhibit differing degrees of spermatogenesis: complete spermatogenesis (complete), up to round spermatid spermatids, up to 1° spermatocytes, or containing no spermatogenesis (empty or Sertoli cell-only). A, B, and C categorical notations above bars denote statistically significant differences between groups (p<0.05) as determined by Tukey-Kramer ANOVA. The number of animals in each experimental group (n) is indicated at the base of each bar. The number of seminiferous tubule cross-sections evaluated per animal is shown in Supplemental Table 3. Details of experimental groups are in Supplemental Figure 1.

