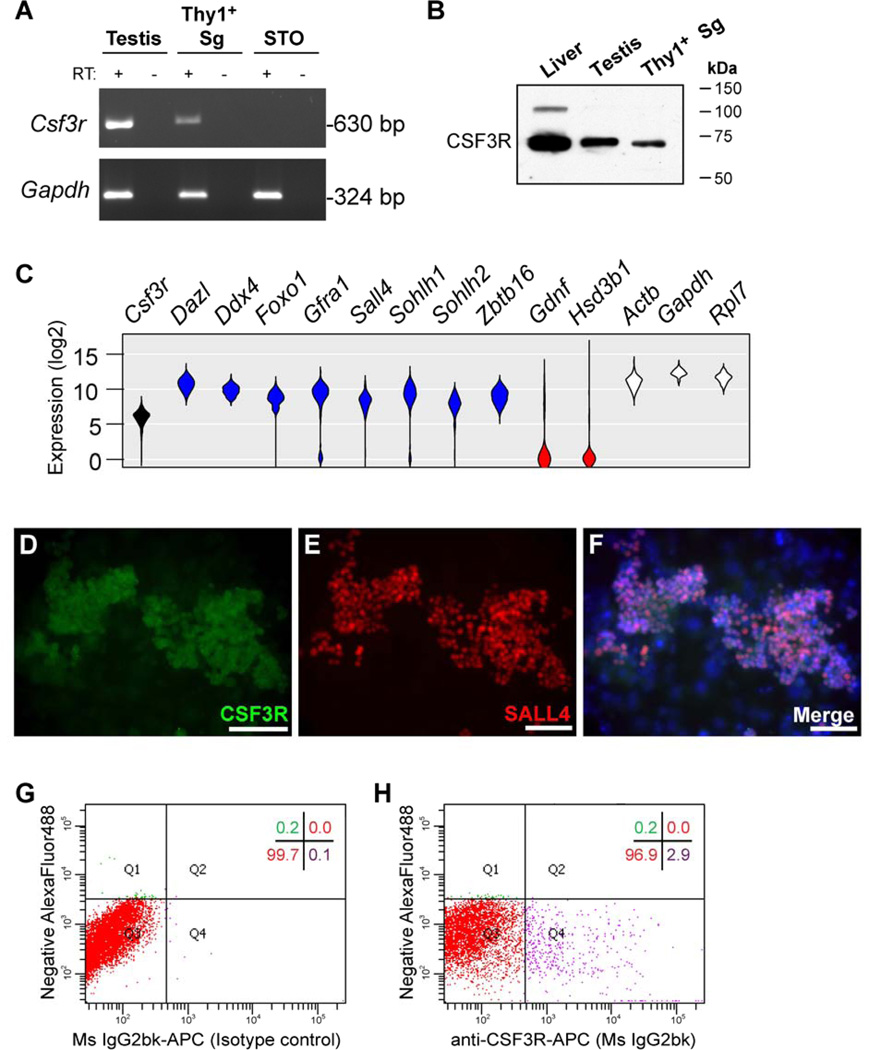
Figure 3. Undifferentiated spermatogonia express CSF3R (G-CSF receptor).
(A) RT-PCR detected mRNAs for (top) Csf3r and (bottom) Gapdh in adult mouse testis, cultured Thy1+ spermatogonia and SNL76/7 STO feeders (STO). Template cDNA samples were from reactions with and without reverse transcriptase (RT: + or −). (B) Western blot detection of CSF3R in liver (+ control), adult testis and cultured Thy1+ spermatogonia. (C) Single-cell qRT-PCR measurement of the steady-state mRNA levels for the noted genes in 75 individual Thy1+ spermatogonia. Data are presented as violin plots of the log2-transformed Ct values from all 75 cells analyzed (curve height = mRNA levels, width = relative cell number). In addition to Csf3r (black), genes were separated into three groups: undifferentiated spermatogonia genes in blue (Dazl, Ddx4, Foxo1, Gfra1, Sall4, Sohlh1, Sohlh2, and Zbtb16), somatic cell genes in red (Gdnf Hsd3b1), and “housekeeping” control genes in white (Actb, Gapdh, Rpl7). Immunofluorescent staining for CSF3R protein in mouse Thy1+ spermatogonia cultures using antibodies that recognize (D) CSF3R and (E) SALL4, a marker of undifferentiated spermatogonia and (F) merged of CSF3R and SALL4 with Hoechst 33342 counterstain (blue, DNA). Staining was compared to omission of primary antibodies (data not shown). Flow cytometry dot plots show Thy1+ spermatogonia cultures stained with (G) isotype control antibodies or (H) CSF3R antibodies, both on the X-axis. Y-axis depicts autofluorescence in the AlexaFluor488 channel. Quadrant statistics are shown in the upper-right of each dot plot and depict the percentage of propidium iodide (PI) negative (viable) cells that fall within the noted quadrant.

