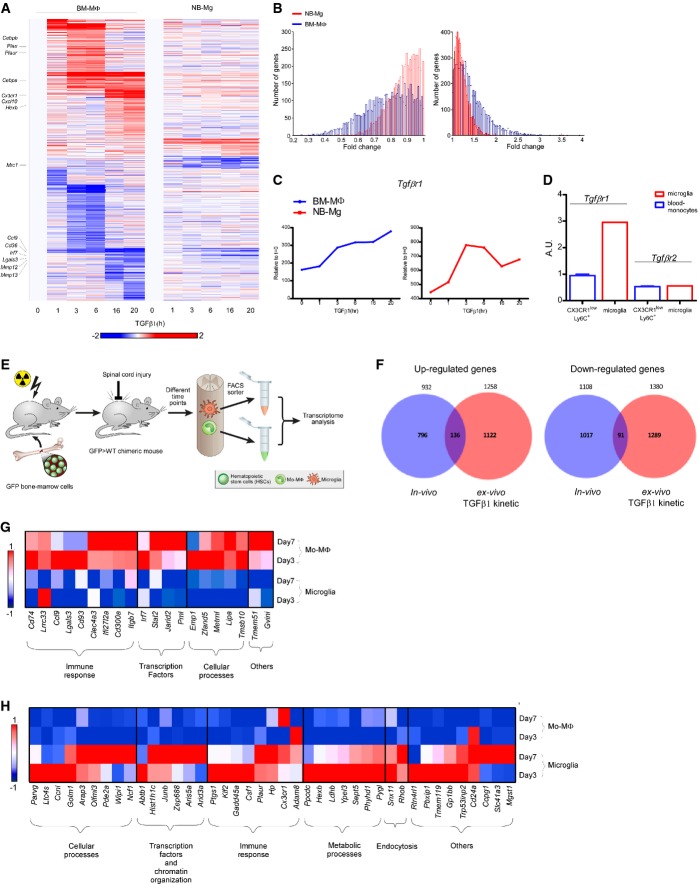
Figure 2. Long exposure to TGFβ1 activates a robust gene expression program in myeloid cells.
- mRNA expression profile of genes, whose expression level was elevated or reduced twofold in at least one of the time points in either TGFβ1 stimulated BM-MΦ or NB-Mg. Genes were clustered according to k-mean of 20 (red, high relative expression; white, mean expression; blue, low relative expression).
- Distributions of the number of genes expressed in BM-MΦ (blue) and NB-Mg (red) that were increased (right graph) or decreased (left graph) along the time course (Kolmogorov–Smirnov test, P-value < 10−5).
- Expression levels of Tgfbr1 in BM-MΦ (blue) and NB-Mg (red) along the time course of TGFβ1 treatment were analyzed by RNA-seq.
- Peripheral CX3CR1lowLy6C+ monocytes and resident microglia were sorted from non-injured CX3CR1GFP/+ mice, and the expression of Tgfbr1 and Tgfbr2 was analyzed using RT-qPCR. RT-qPCR results are normalized to the expression of PPIA.
- eGFP > WT chimeric mice were injured, and parenchymal segments of 0.5 mm from each side of the spinal cord lesion site were excised on different days following SCI. GFP+ mo-MΦ and GFP− resident microglia were sorted by FACS and collected directly into lysis buffer. RNA was harvested, and gene expression profile was analyzed by RNA-seq.
- Venn diagrams of genes that were up-regulated (left panel) or down-regulated (right panel) in BM-MΦ at least twofold by exposure to TGFβ1 ex vivo (red) and genes from the in vivo kinetic studies whose expression was significantly different (P-value < 0.05) between microglia and mo-MΦ, selecting those that were expressed to a higher (left panel) or lower (right panel) extent in microglia compared to mo-MΦ along the kinetics following SCI (blue), respectively. Hypergeometric test for the intersection of up-regulated genes, P-value < 10−5; hypergeometric test for the intersection of down-regulated genes, P-value = 3 × 10⁻³; n = 12 for all kinetic following SCI.
- Expression profile of genes that were down-regulated at least twofold by BM-MΦ following exposure to TGFβ1 ex vivo and were highly expressed by mo-MΦ compared to microglia (twofold) at days 3 and 7 following SCI, divided into functional groups.
- Expression profile of genes that were up-regulated by BM-MΦ at least twofold following exposure to TGFβ1 ex vivo and were highly expressed by microglia (twofold) compared to mo-MΦ at days 3 and 7 following SCI, divided into functional groups.
Data information: Data represent the average expression in two independent experiments; each experiment was performed in duplicate. Red, high relative expression; white, mean expression; blue, low relative expression.

