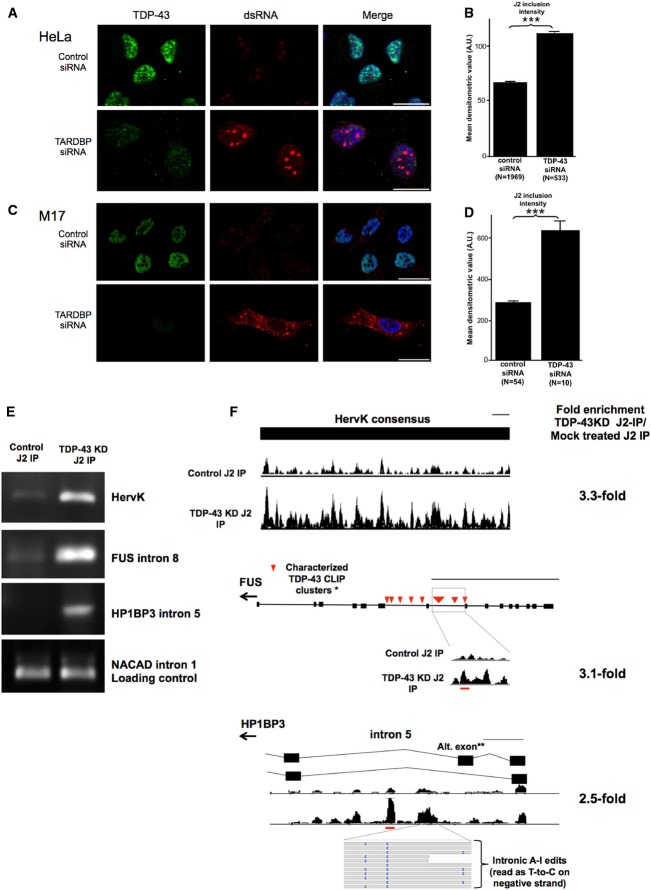
Figure 8. Mammalian TDP-43 also functions to limit the accumulation of dsRNA.
- Cultured HeLa cells depleted for TDP-43 (green) with TARDBP siRNA display increased intensity of J2 anti-dsRNA labeling (red) within nuclear foci. Scale bars, 20 μm.
- Densitometric quantification of the intensity of nuclear dsRNA foci. Graph shows the mean J2-dsRNA densitometric value, error bars = SEM. ***P < 0.0001 (Student's t-test). N = number of objects detected in each group.
- Cultured M17 cells display increased nuclear and cytoplasmic dsRNA staining (red) upon knockdown of TDP-43. Scale bars, 20 μm.
- Quantification of nuclear dsRNA in TDP-43 knockdown M17 cells. Graph shows the mean J2-dsRNA densitometric value, error bars = SEM. ***P < 0.0001 (Student's t-test). N = number of objects detected in each group.
- Semi-quantitative RT–PCR of RNA precipitated from J2-IP on lysate from mock-treated M17 cells (left panel) and TDP-43 knockdown M17 cells (right panel). RT–PCR was done in triplicates (only one replicate shown).
- Expression tracks from J2-IP RNA-seq in regions shown to have increased recovery in TDP-43 knockdown J2-IP compared to mock-treated controls. The gene model for each region is shown above the expression tracks. Evidence of A-to-I RNA editing in human sequencing read is also shown for HP1BP3. Herv-K expression tracks represent reads mapping to a consensus sequence of the Herv-K genome. All expression tracks are normalized to the number of reads in each sample, and the height of the track indicates reads depth. The fold enrichment by J2-IP in TDP-43 knockdown over control (normalized to total RNA-seq) for each region is shown to the right. The thin black line indicates scale, and scale is set to 500 bp. Red lines show the location of primer sequences relative to the gene. Expression tracks for NCAD1 (loading control) are shown in Supplementary Fig S20.
Source data are available online for this figure.

