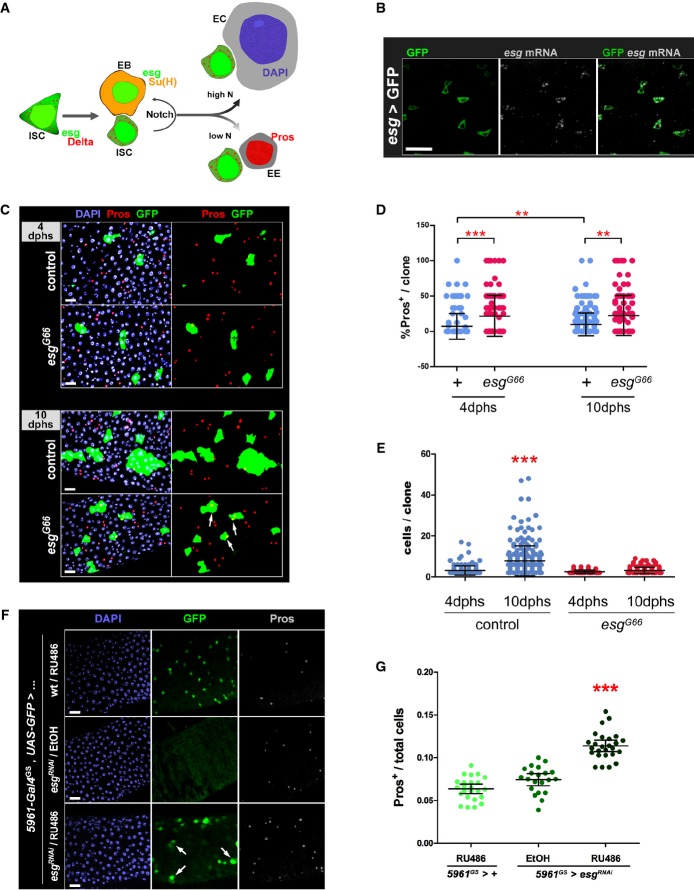
Figure 1. Loss of Escargot induces ISC loss and a bias toward the enteroendocrine cell fate.
- A Drosophila posterior midgut epithelium. Schematic representation of cell types and their lineage relationships (see text for details; Micchelli & Perrimon, 2006; Ohlstein & Spradling, 2006). Intestinal stem cells (ISCs) and enteroblasts (EBs) can be usually identified by an esg-GFP reporter, or expression of GFP under control of ISC/EB-specific drivers. ISCs express Delta (Dl, which results in a characteristic punctate staining of ISCs), which activates Notch in EBs (revealed by β-GAL staining of flies that carry a Su(H)-lacZ reporter of Notch activity (Bray & Furriols, 2001)). Enteroendocrine cells (EE) are identified by nuclear Prospero (Pros) staining, whereas enterocytes (ECs) can be distinguished based on their large polyploidy nuclei (as revealed by DAPI staining of DNA).
- B esg mRNA is restricted to ISC/EB cells. FISH/IF staining for esg mRNA (red, gray) and GFP protein (green) in midguts of 3- to 5-day-old adults carrying an ISC/EB-specific reporter (“esg > GFP” = esg-Gal4, UAS-GFP).
- C Clonal analysis of esg mutant ISCs. Representative images of wild-type (control) and esg mutant (esgG66) MARCM clones stained as indicated with DAPI, Pros and GFP, 4 or 10 days after heat shock (dphs). esgG66 mutant clones are smaller and contain EE cells more frequently than controls (arrows).
- D, E Loss of esg results in loss of ISCs and an increase in EE cells. A CellProfiler analysis of images as those in (C) confirmed that esgG66 mutant clones are significantly enriched for EE cells (D) and have significantly less cells (E) than their control counterparts (***P < 0.001 and **P < 0.01, Kruskal–Wallis/Dunn test).
- F, G Phenotypes induced by RNAi-mediated depletion of esg in ISC/EBs. (F) RNAi-mediated knockdown of Esg in ISC/EBs caused an accumulation of EE cells and a noticeable change in the morphology and size of some ISC/EBs (arrows in bottom panel; e.g. compare the large GFP+ cell identified by the rightmost arrow to its two smaller neighbors). Midguts from adults of the indicated genotypes were stained with DAPI (all nuclei), GFP (ISC/EB) and Pros (EE cells) following a 6-day incubation at 25°C on 10 μg/ml RU486 or EtOH-containing food (as indicated). (G) Images as those in (F) were processed with CellProfiler to quantify the relative proportion of EE cells in the indicated genotypes/treatments (see Materials and Methods for details). Each data point is an average proportion calculated from four independent images per midgut, and the bars are the geometric mean ± SEM of those averages. *** denotes a significant enrichment of EE cells following Esg knockdown in ISC/EBs compared to either control group (P < 0.001, Kruskal–Wallis/Dunn test).
Data information: Scale bars = 20 μm.

