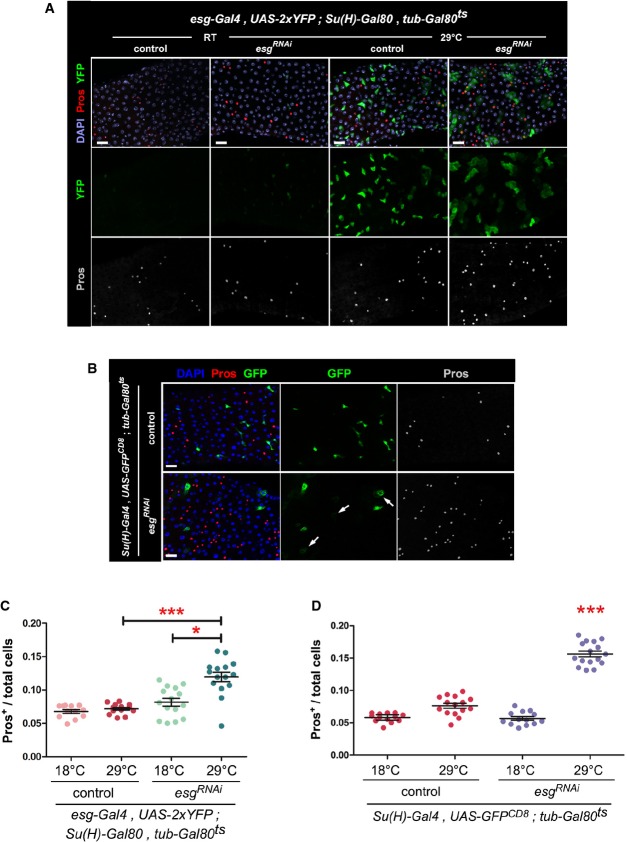
Figure 2. Loss of Esg function causes an accumulation of EE cells and an altered EB morphology.
- Phenotypes caused by depletion of esg in ISCs. Midguts of the indicated genotype were stained with DAPI (all nuclei), YFP (primarily ISCs) and Pros (EE cells) following 6 days of incubation at the indicated temperatures (control = outcross to w1118 flies).
- Phenotypes caused by depletion of esg in EBs. Midguts of the indicated genotypes were stained with DAPI (all nuclei), GFP (EBs) and Pros (EE cells) following 6 days of incubation at 29°C to allow the EB-restricted expression of UAS-esgRNAi or a UAS-GFPnls (control). Notice the stronger nuclear GFP staining in control samples due to GFPnls expression. Arrows point to examples of EBs with a wider cytoplasm, dimmer GFP staining and seemingly polyploid nuclei following Esg knockdown.
- EE cell accumulation induced by depletion of esg in ISCs. CellProfiler was used as in Fig1G to quantify the relative proportions of EE cells in midguts in images as those in (A). *** and * denote a statistically significant difference in the relative proportion of EE cells in pairwise post-test comparisons indicated by the corresponding bars (P < 0.001 and P < 0.05 Kruskal–Wallis/Dunn test).
- EE cell accumulation induced by depletion of esg in EBs. CellProfiler was used as in (C). *** denotes a statistically significant accumulation of EE cells following EB-specific Esg knockdown, as compared to all other samples (P < 0.001, Kruskal–Wallis/Dunn test).
Data information: Scale bars = 20 μm.

