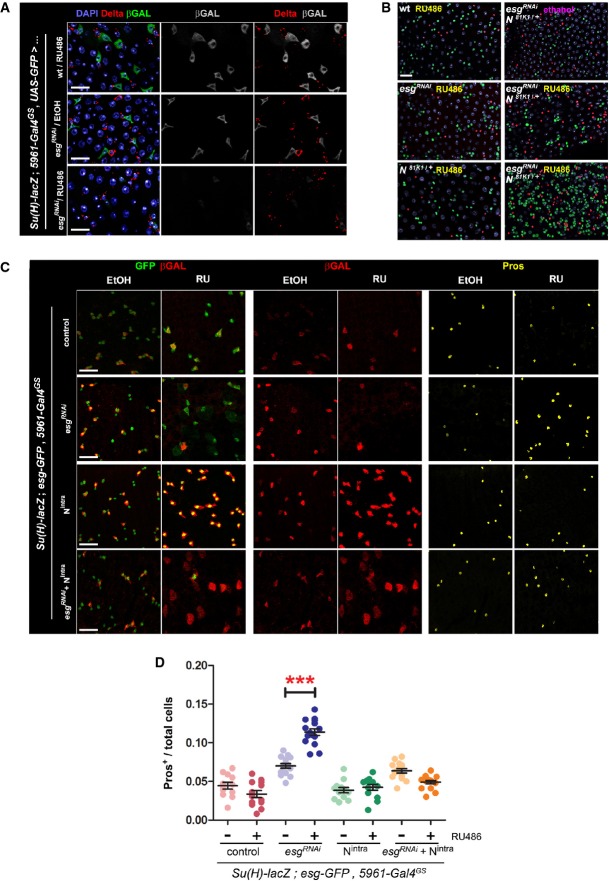
Figure 3. Loss of Esg function in ISC/EBs leads to decreased Notch activity in EBs.
- A Esg knockdown in ISC/EBs causes reduced Notch reporter activity in EBs. Use of a Notch (N) activity reporter (Su(H)-lacZ; Bray & Furriols, 2001) reveals a noticeable reduction in N signaling within EBs, despite of seemingly unaltered Delta expression in ISCs. Midguts of the indicated genotypes were stained with DAPI (all nuclei), Delta (ISCs) and β-GAL (EBs) following 4 days of incubation in 10 μg RU486/ml or ethanol-containing food as indicated.
- B Epistasis analysis between Esg (esgRNAi) and Notch (N81K1). Midguts of the indicated genotypes were stained with DAPI (all nuclei), GFP (esg+ cells) and Pros (EE cells) following 6 days of incubation in 5 μg/ml RU or ethanol, as indicated. Notice that a lower concentration of RU486, resulting in a more moderate induction of esgRNAi expression, did not produce the larger and dimmer GFP+ nuclei or EE cell accumulation typically observed with higher doses of RU486. Approximately 83% (15/18) of the N81K1/+; esgRNAi guts showed a noticeable accumulation of EE cells in an otherwise normal-looking epithelium (right column, middle panel), whereas the remaining 17% showed a drastic expansion of diploid, esg+ and EE cells (right column, lower panel), reminiscent of stronger Notch loss-of-function mutations (compare with Supplementary Fig S3B).
- C, D Constitutively active Notch signaling rescues the EE cell enrichment phenotype caused by Esg knockdown. (C) An esgRNAi construct and a constitutively active Notch construct (Nintra) were expressed alone or in combination in ISC/EBs using the 5961GS driver. Midguts of the indicated genotypes were stained for GFP, β-GAL (EBs) and Pros (EE cells) following 7 days of incubation in ethanol or 25 μg/ml RU486 as indicated. (D) Images as those in (C) were processed with CellProfiler to quantify the relative proportion of EE cells. Midguts overexpressing the esgRNAi construct alone were the only sample that showed a significant EE enrichment relative to the corresponding EtOH control (***P < 0.001, one-way ANOVA/Bonferroni test).
Data information: Scale bars = 20 μm.

