
Figure 4. Amun is a candidate target of Esg.
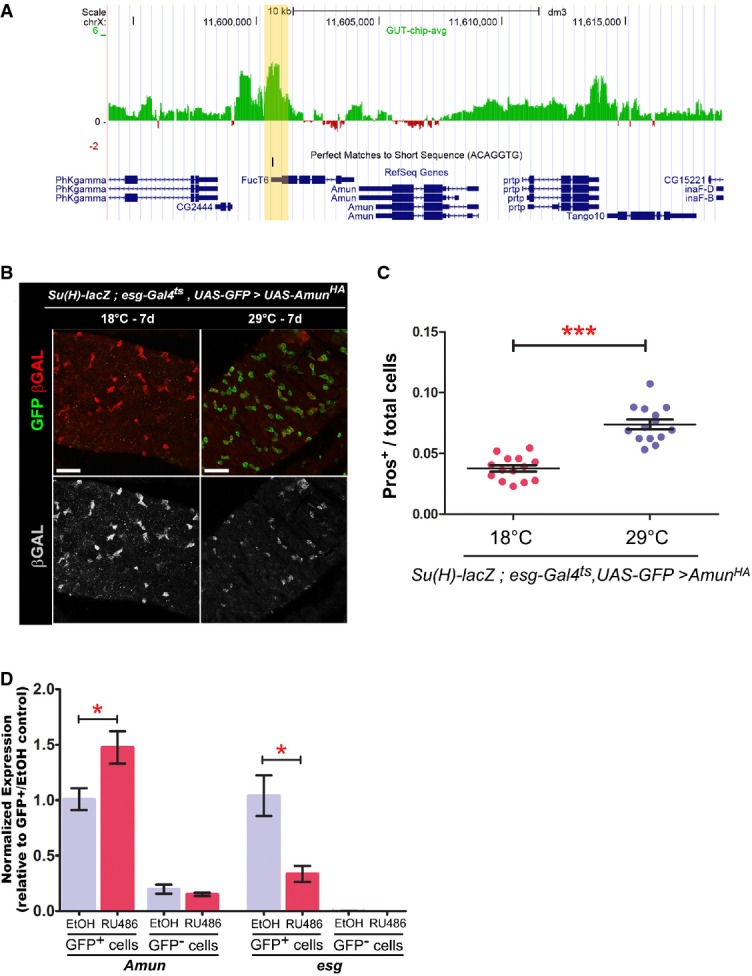
- A Esg DamID profile surrounding the Amun locus. Data are displayed as custom UCSC Genome Browser tracks. Green/red bars represent the average log2 (intensity ratio) between the Esg:Dam and Dam-control samples, mapped to the genomic regions ± 10 kb from Amun (see Supplementary Materials and Methods for further details). The yellow shading highlights an Esg-bound region (EBR), which includes a consensus Esg E-box ([G/A]CAGGTG; Fuse et al, 1994).
- B, C Amun overexpression in ISC/EBs resembles a reduction in N signalling. (B) Midguts of the indicated genotype were stained with DAPI (nuclei), GFP (ISC/EB) and β-GAL (N activation). (C) CellProfiler quantification of the relative proportion of EE cells in midguts from (B). A similar result was obtained using the milder 5961GS driver (Supplementary Fig S4). ***P < 0.001, Mann–Whitney U-test. Scale bars = 20 μm.
- D Amun mRNA upregulation following Esg knockdown in ISC/EBs. qPCR measurements of relative transcript abundances for the indicated genes from esg-GFP+ and esg-GFP− cells isolated by FACS sorting from esg-GFP, 5961GS > UAS-esgRNAi flies incubated on ethanol or RU486 (25 μg/ml for 3 days) to induce RNAi expression. Shown are means (± SEM) of efficiency-corrected relative quantities for each primer set, normalized to the corresponding GFP+/EtOH sample and to RpL32 levels (used as reference). * denotes a significant reduction in esg and an increase in Amun transcript levels, respectively (P < 0.05, two-tailed unpaired Student's t-test).