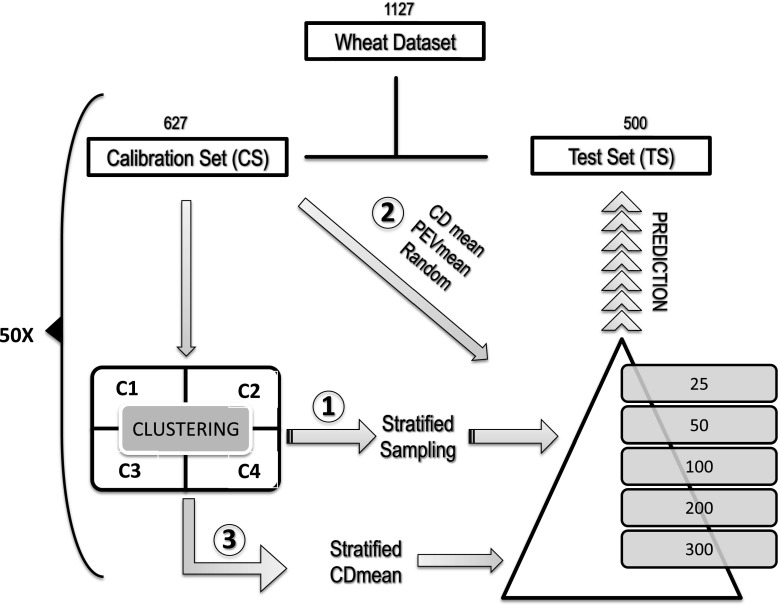
Fig. 1.
Example of optimization of training population set (TRS) scheme in the wheat dataset. The three methods are represented in numerical circles. Number 1 represents the stratified sampling method, number 2 the CDmean and PEVmean approaches and number 3 the stratified CDmean. C1–C4 acronyms indicate the number of cluster after analysis. More details about the specific methods can be found in the supplementary information in figures S3, S4 and S5. The optimization process was repeated over 50 runs and in a TRS size of 25, 50, 100, 200 and 300 genotypes

