
Fig. 2.
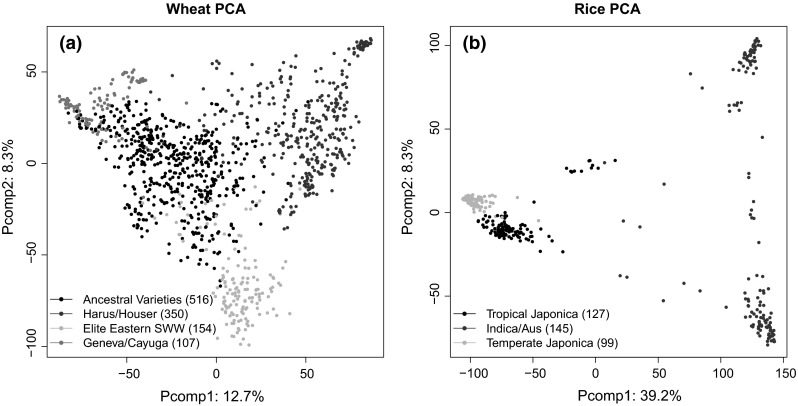
Plots of the first two principal components and the cluster analysis using R with 38,893 GBS and 36,901 SNPs markers on a wheat and b rice germplasm. Each solid circle represents a genotype and the colors indicate clusters membership. Legends summarize the distribution of the subpopulations for both germplasm. Number of genotypes per cluster is indicated in parenthesis (color figure online)