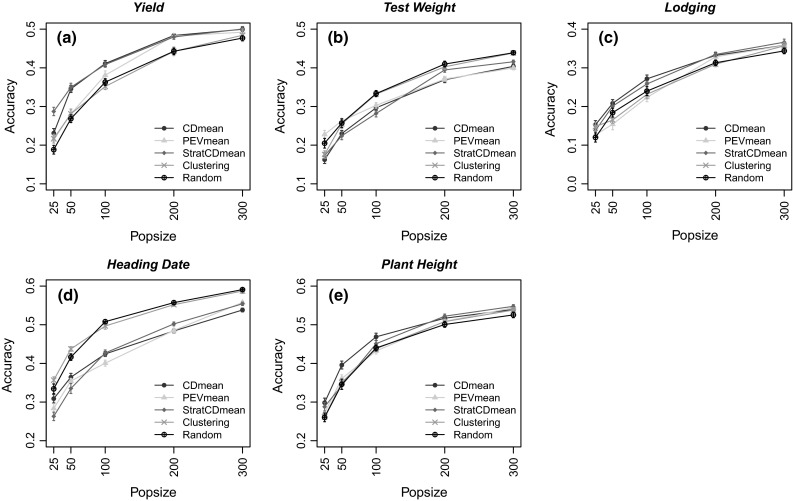
Fig. 3.

Accuracies of the predictions of the TS genotypes in the wheat germplasm. The calibration sets were defined by maximizing CDmean; minimizing PEVmean; maximizing CDmean within cluster; stratified proportional sampling and random sampling. Four different population sizes (25, 50, 100, 200 and 300) were used for the optimization algorithm in five different traits (a yield, b test weight, c lodging, d heading date, e plant height). Standard error is indicated for each point over the 50 runs. Optimization of CDmean, PEVmean and StratCDmean was made with the heritability measured for each trait in each germplasm (color figure online)
