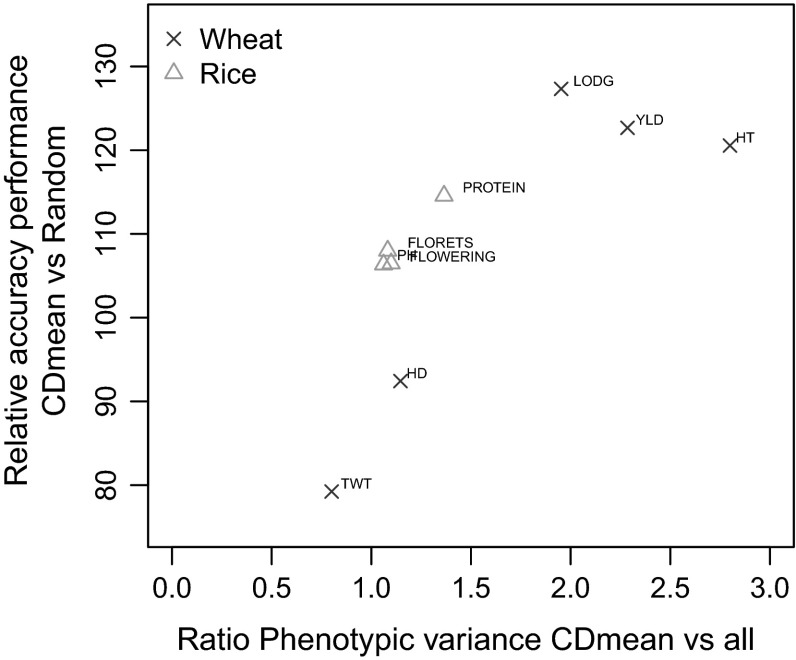
Fig. 6.
Relative performance of CDmean versus the random sampling method as a function of the ratio of the phenotypic variance between the top 40 most selected genotypes by CDmean and the overall phenotypic variance in wheat (red-cross) and rice (blue-triangle). Traits per germplasm are indicated in wheat as YLD yield, TWT test weight, LODG lodging, HD heading date, HT plant height and in rice as FLORETS florets per panicle, FLOWERING flowering time, PH plant height, PROTEIN protein content (color figure online)

