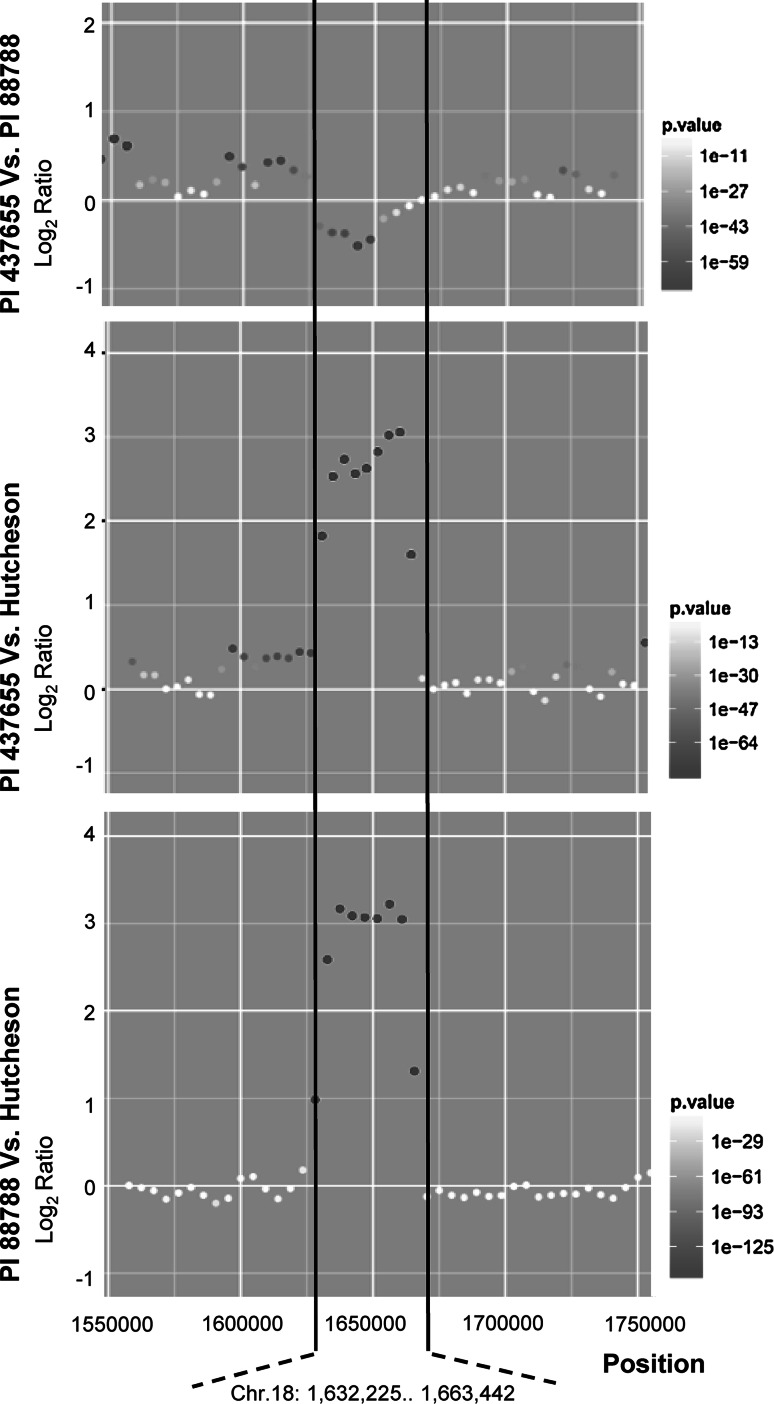
Fig. 2.
Copy number variation of the Rhg1 locus detected by CNV-seq software among PI 437655, PI 88788, and cv. Hutcheson by use of whole-genome resequencing. The Y axis represents log2 ratios; the X axis represents genomic positions along chromosome 18 of Williams 82 reference genome. The interval between two black lines indicated the region of Rhg1. The dot represents the fold change of copy number variation in comparison with the corresponding soybean line. The red color gradient represents P value calculated on each of ratios (color figure online)

