Figure 4.

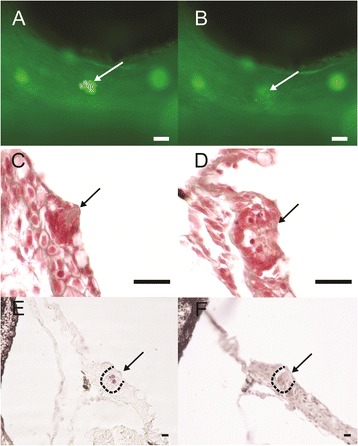
Representative figures of targeted neuromast laser ablation on infraorbital three canal neuromast. (A) Before and (B) after neuromast laser ablation in live zebrafish specimens stained with FM1-43. Masson’s trichrome stained cross-section of neuromast of (C) control-side and (D) post-ablation neuromasts. (E and F) TUNEL stained cross-section of ablated neuromasts (E) and control side (F). Arrow indicates neuromasts. Scale bars are (A and B) 25 μm and (C-F) 10 μm.
