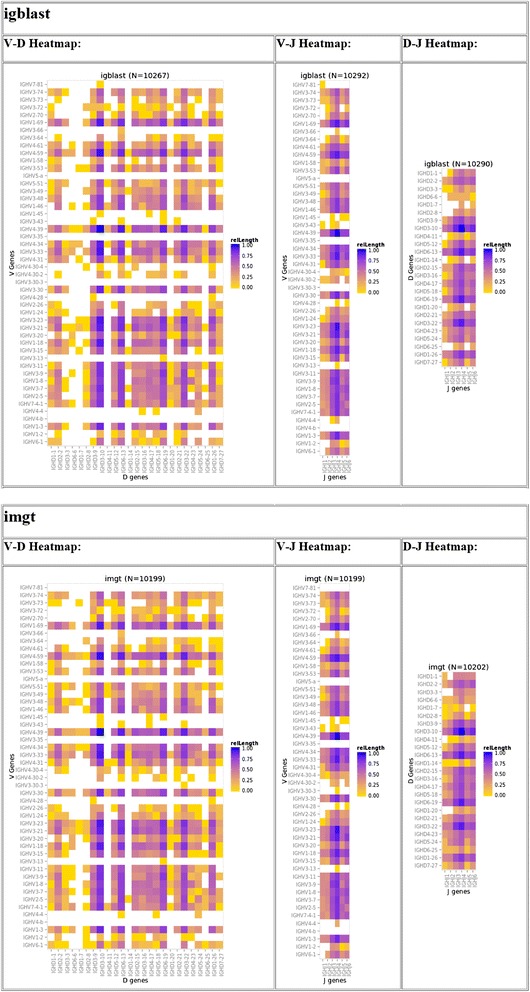
Figure 5.

igReport output for S22 igBLAST repertoire analysis. The scaled frequency count (range 0 to 1) of clonal types for each V, D and J combination are represented with a heatmap which range from maximum (purple) to minimum (yellow) frequency with white representing those clonal types that are absent from IMGT or igBLAST analysis.
