Figure 6.

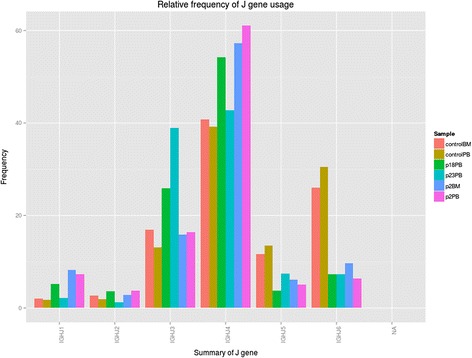
igReport output for reanalysis of data from Ijspeert et al. [ 9 ]. A sample view two control (Control BM, Control PB), one bone marrow (P16BM) and three peripheral blood samples (P15PB, P16PB, P18PB).

igReport output for reanalysis of data from Ijspeert et al. [ 9 ]. A sample view two control (Control BM, Control PB), one bone marrow (P16BM) and three peripheral blood samples (P15PB, P16PB, P18PB).