
Figure 2.
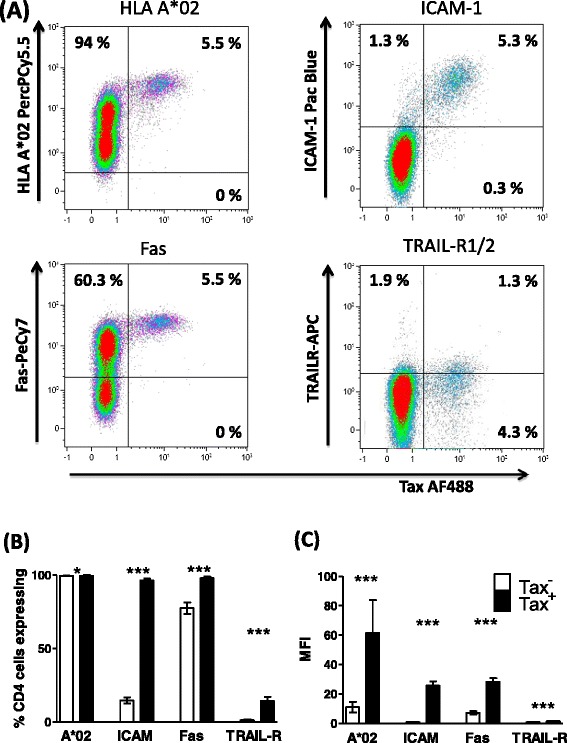
Tax + CD4 + cells express elevated levels of HLA-A*02, ICAM-1, Fas, and TRAIL-R1/2. Purified CD4+ cells from 15 infected individuals (7 AC, 1 P, 7 HAM) were cultured for 24 h, after which the cell surface was stained with antibodies specific for HLA-A*02, ICAM-1, Fas, Trail-R1/2 and CD4. Subsequently, cells were stained for Tax protein and analysed by flow cytometry. (A) Staining of one representative individual’s CD4+ cells. Numbers indicate the percentage of cells in each quadrant. (B) Frequency and (C) intensity of surface protein expression on Tax+CD4+ (black bars) and Tax−CD4+ (white bars) for 15 individuals. Statistics: Tax+ vs. Tax−, Wilcoxon matched pairs test, two tailed; * denotes p < 0.02, *** denotes p ≤ 0.0002. Bars denote the mean ± SEM. See Additional file 6 for donor characteristics.