
Fig. 1.
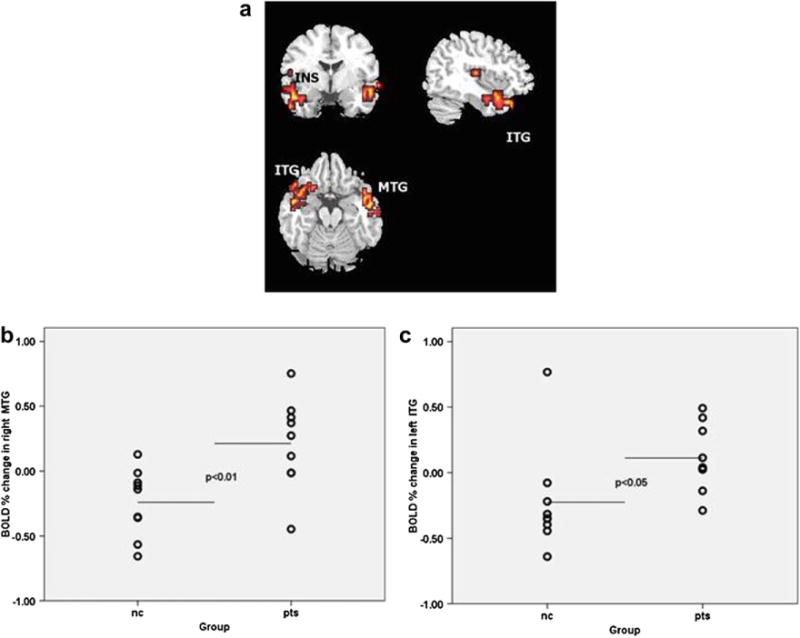
Between-group differences in BOLD response to disgust. a. Axial, coronal and sagittal images depicting increased neural responses in patients with depression in response to prototypical (100%) intensity of disgust. The right and the left sides of each brain slice are displayed on the right and left sides of each image, respectively. BA, Brodmann area. MTG: middle temporal gyrus; ITG: inferior temporal gyrus; INS: insula. b. Scatter plot of neural response values (expressed as % signal change) extracted from the significant cluster in right middle/inferior temporal gyrus. Horizontal lines indicate means. c. Scatter plot of neural response values (expressed as % signal change) extracted from the significant cluster including left insula, left orbito-frontal cortex, left middle/inferior temporal gyrus. Horizontal lines indicate means. nc: normal controls; pts: patients with depression.