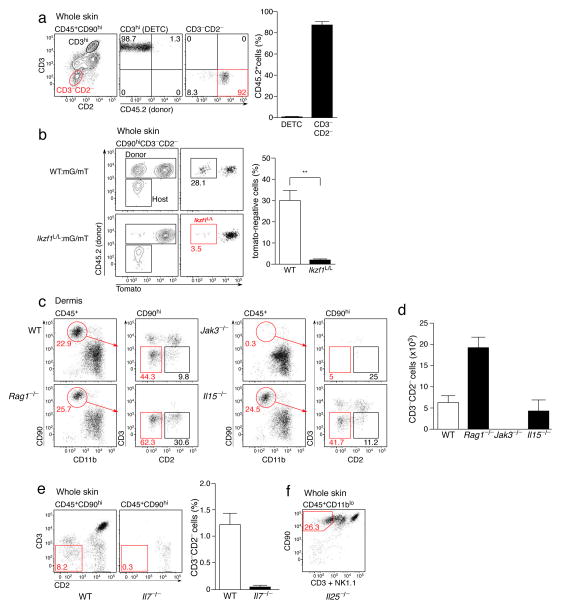
Figure 2. Development and homeostatic requirements of dILC2.
(a) Representative dotplots (left) of mouse skin from CD45.1+ mice 8 weeks post-irradiation and transfer of bone marrow from CD45.2+ mice. Right: Percentages of DETC and dILC2 that were of donor-origin. Data are mean ± s.d. and are pooled from 2 independent experiments (n = 7). (b) Representative dotplots and graph depicting the relative contribution of donor (CD45.2+) cells to dILC2 in 50:50 wild-type mG/mT(mTomato+):wild-type (CD45.2+) (top panels, open bar) and 50:50 wild-type mG/mT(mTomato+):Ikzf1L/L (CD45.2+) (bottom panels, filled bar) mixed bone marrow chimeras 8 weeks after bone marrow transfer into wild-type (CD45.1+) hosts. Data are mean ± s.d. and are representative of two independent experiments (n = 3 for control chimeras, n = 2 for wild-type:Ikzf1L/L chimeras). (c) Representative dotplots of CD45+ CD90hi cells in the dermis of wild-type, Rag1−/−, Jak3−/− and Il15−/− mice. Red boxes indicate CD3−CD2− dILC2. (d) Absolute numbers of dILC2 in the dermis of indicated mouse strains. Cell counts obtained from two ears. Data are mean ± s.d. and are representative of two independent experiments (n = 3). (e) Representative dotplots (left) and frequency (right) of dILC2 in wild-type and Il7−/− skin. Data are mean ± s.d. (n = 3). (f) Representative dotplot of CD45+ CD11blo cells in the skin of Il25−/− mice. Red gate indicates CD90hi CD3− NK1.1− dILC2.

