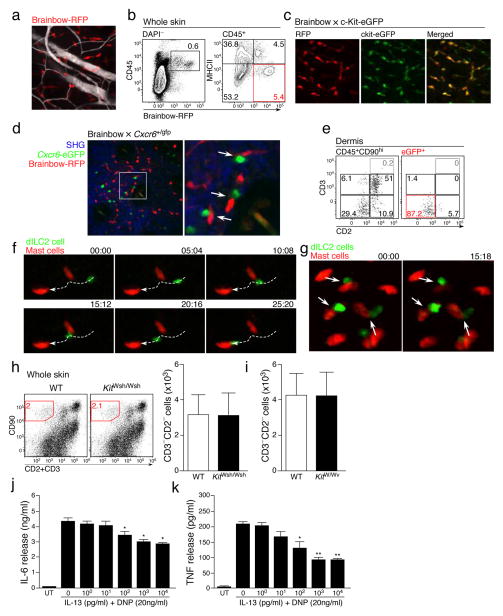
Figure 5. dILC2 interaction with skin-resident mast cells.
(a) Representative image of the Brainbow32 dermis by intravital multiphoton microscopy. Blood vessels were visualized using Evans blue (white). Image is a z-projection through a dermal volume of 60μm. (b) Representative flow cytometry plots of total skin cells (left) and CD45+ cells (right) from a Brainbow mouse. Red gate indicates RFPhi MHC-IIlo cells. Data are representative of 3 independent experiments. (c) Representative images of the dermis from Brainbow × c-Kit-eGFP33 mice. RFP+ cells, red. eGFP+ mast cells, green. Double-positive cells, yellow. (d) Representative image of Brainbow × Cxcr6+/gfp skin by intravital multiphoton microscopy. Extracellular matrix in the dermis was detected by SHG signals (blue). Cxcr6-eGFP+ cells shown in green. RFP+ cells are red. Arrows indicate RFPhi mast cells in close proximity with eGFP+ cells. (e) Representative dotplots of CD45+CD90hi (left) and eGFP+ cells (right) from the skin of an albino Brainbow mice 8 weeks after irradiation and co-transfer of bone marrow from Rag1−/− Cxcr6+/gfp and RAG-1-sufficient non-fluorescent mice. Gates for eGFP+ cells in right panel were determined on the total CD45+CD90hi population (left). (f) Representative time-lapse images of migratory dILC2 (green) in chimeric mouse skin by intravital multiphoton microscopy. Red, mast cells. White line, track of ILC2 migration during the observation period. Time shown in mm:ss. (g) Representative time-lapse images of chimeric mouse skin by intravital multiphoton microscopy. Arrows indicate dILC2 (green) that formed extended interactions with mast cells (red) throughout the observation period. Time shown in mm:ss. (h) Representative dotplots (left) and absolute number (right) of CD90hi CD3− CD2− dILC2 in wild-type and B6-KitW-sh/W-sh ears. (i) Absolute number dILC2 in wild-type and WBB6F1-KitW/W-v ears. Data in (i) and (j) are mean ± s.d. (n = 3). (j and k) Effect of exogenous IL-13 on cytokine production by mast cells in vitro. Mast cells were pre-incubated with mrIL-13 (0–10,000 pg/ml), sensitized with anti-DNP IgE (2 μg/ml) for 16 h, washed then stimulated with DNP-HSA (20 ng/ml) in the presence of rmIL-13 (0 – 10000 pg/ml) for 6 h. (j) IL-6 and (k) TNF in supernatant were measured by ELISA. Data in (k) and (l) are expressed as mean ± s.e.m. for 3 independent experiments. Significant differences between cytokine release by DNP alone and in the presence of IL-13 were determined by one way ANOVA with Dunnett’s post-test. * P < 0.01, **P < 0.001.

