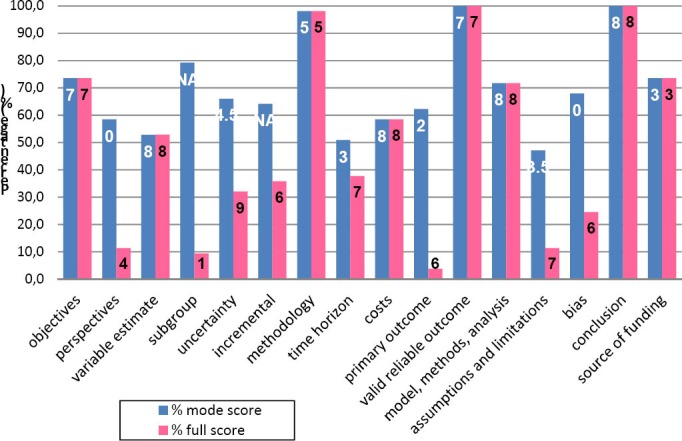
Figure 2.

Proportion of economic evaluations (n=53) that obtained QHES mode and full scores for each criterion. The black- and white-coloured numbers in the bar chart represent the mode and full score respectively, for each criterion. These criteria are listed and named according to the QHES instrument; ‘objectives’ represents Criterion 1, ‘perspectives’represents Criterion 2, and so on.
