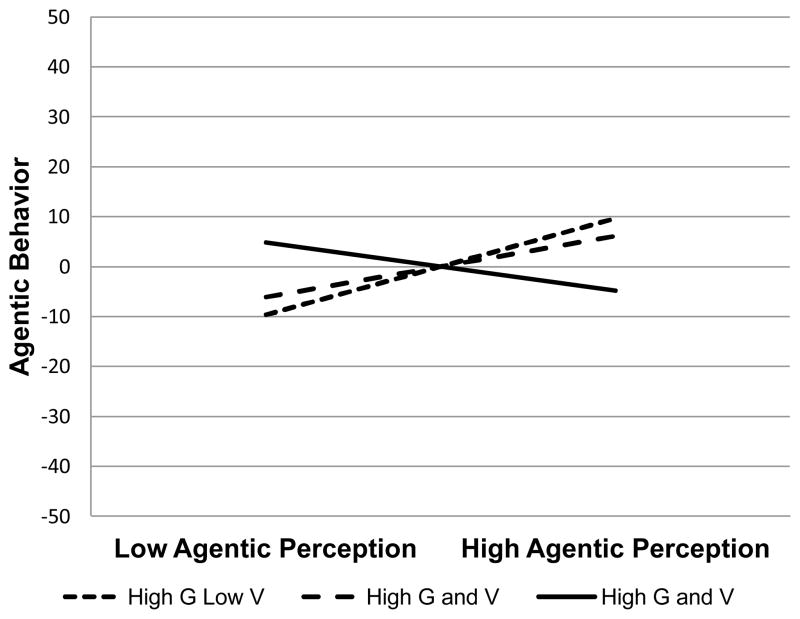
Figure 1.
Plot of significant simple slopes for the four way interaction of agentic and communal interpersonal perceptions, narcissistic grandiosity (NG) and narcissistic vulnerability (NV).
Note. High and low agentic perception plotted at +/− one standard deviation (SD) from the sample centered average. High G Low V = slope calculated with grandiosity +1 SD and vulnerability −1 SD from sample centered average. High G and V = slope calculated with grandiosity and vulnerability +1 SD from sample centered average. Dashed lines represent when perceived communion was +1 SD from the sample’s average, solid line represents when perceived communion was −1 SD from the sample’s average. Agentic behavior ranges from −100 to 100.

