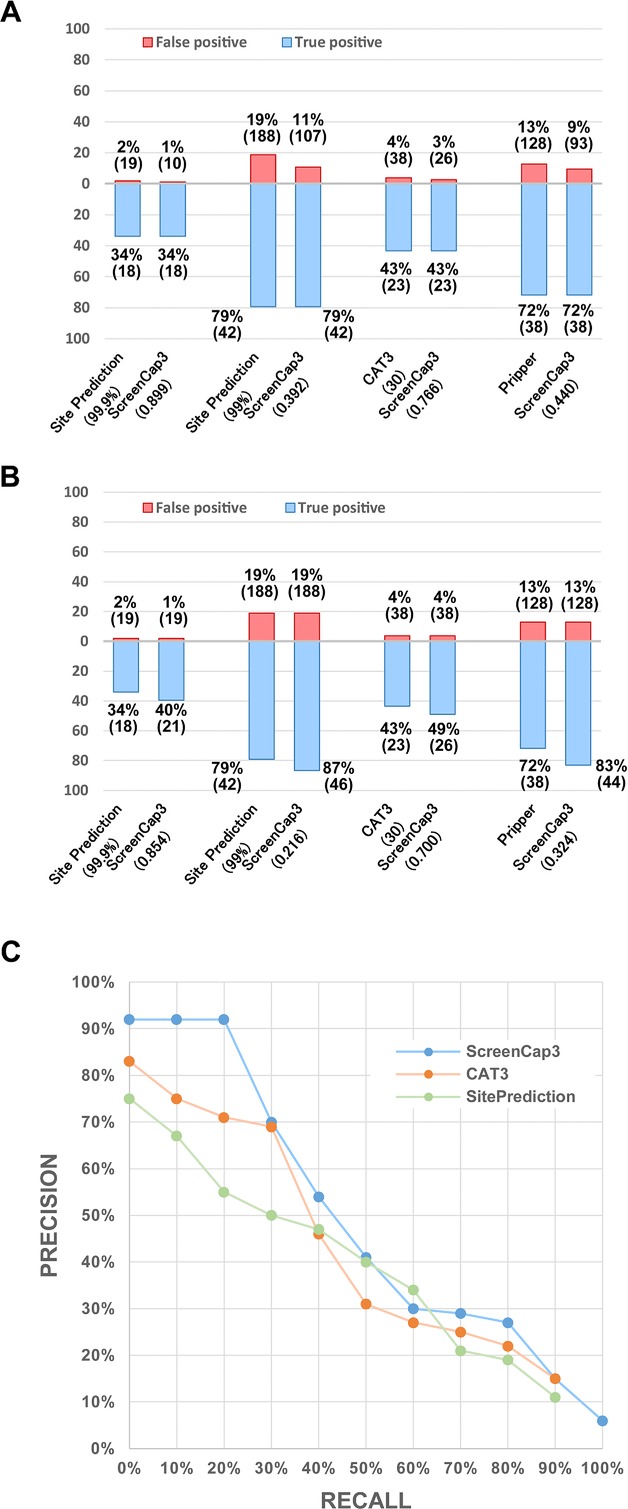
Figure 2.

(A) Comparison of the number of false positives while attaining an equal number of true-positive results. Corresponding cut-off values are shown in parentheses. (B) Comparison of the number of true positives while attaining an equal number of false-positive results. Corresponding cut-off values are shown in parentheses. (C) PR curve of three tools at the site level. Recall is defined as TP/(TP + FN). Precision is defined as TP/(TP + FP), here TP = number of true positives, FN = number of false negatives, and FP = number of false positives.
