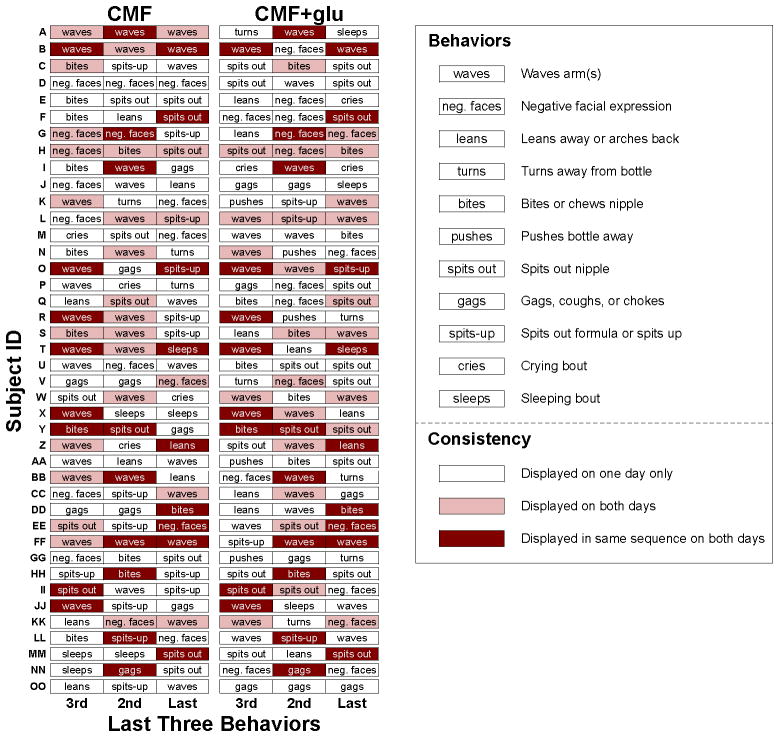
Figure 1. Patterning of the last three behaviors displayed by each individual infant.
Each row represents an individual infant; subject IDs were randomly assigned. The left and right columns display the third to last (3rd), second to last (2nd), and last behaviors during the CMF and CMF+glu meal, respectively. A white cell indicates a behavior that an infant displayed on one day only. A pink cell indicates a behavior that an infant displayed on both days. A maroon cell indicates a behavior that an infant displayed in the same sequence (e.g., as the first behavior) on both days.

