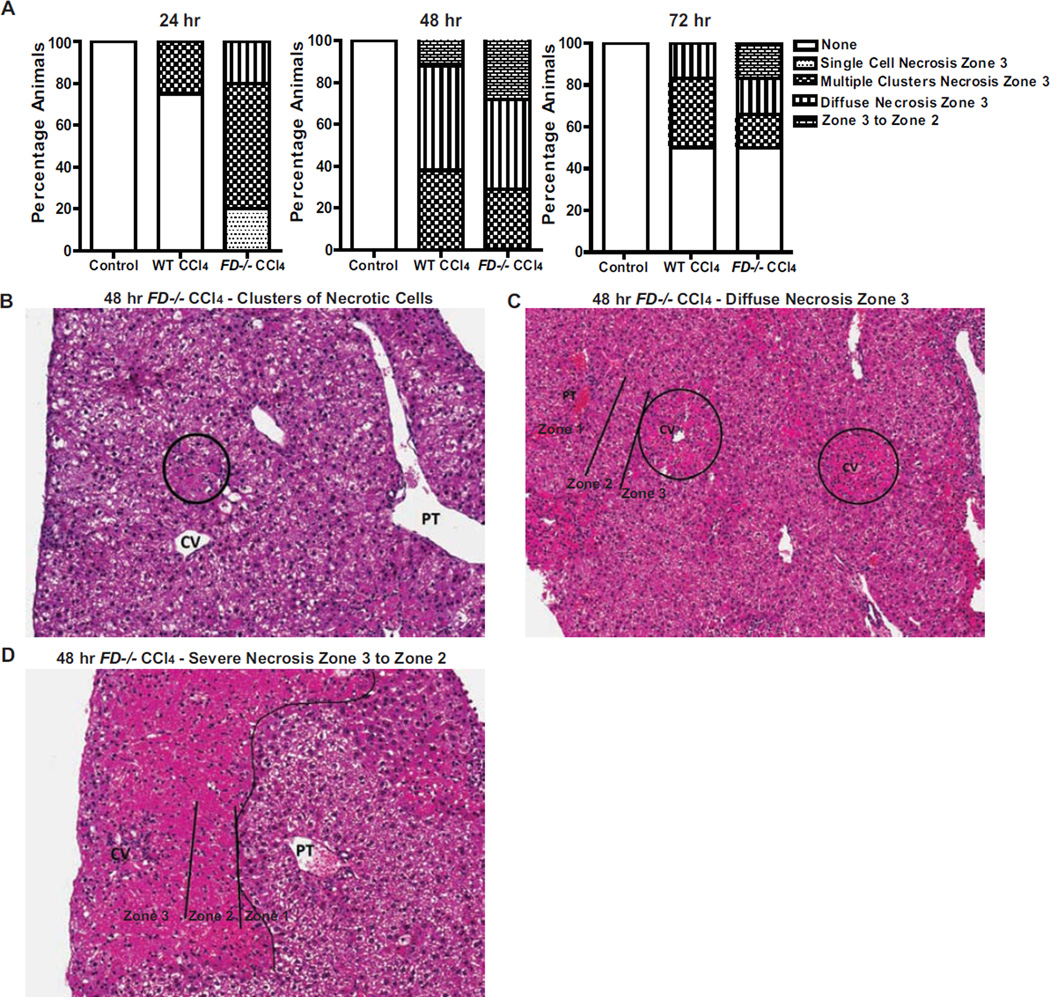
Figure 4. FD−/− mouse livers exhibit more severe necrosis following CCl4 exposure.
A. Identification of the presence of cellular necrosis evaluated from histological Hematoxylin and eosin (H&E)-stained sections of livers from WT and FD−/− mice at 24, 48 and 72 hr following a single injection of CCl4 are shown. Bars represent percentage of mice in each group exhibiting the pattern of cellular necrosis described. The number of mice at each time point are the same as those indicated in Figure 3. B–D. Representative histological sections of livers from FD−/− mice exhibiting the predominant patterns of necrosis at 48 hr after a single injection of CCl4 are shown (CV: central vein; PT: portal tract): B. Clusters of necrotic cells in the lobules (H&E stain, 200×) C. Diffuse zone 3 necrosis involving the centrilobular region (also called zone 3) (H&E stain, 100×) D. More extensive necrosis not only involving the zone 3, but also extending to zone 2 (H&E stain, 200×).

