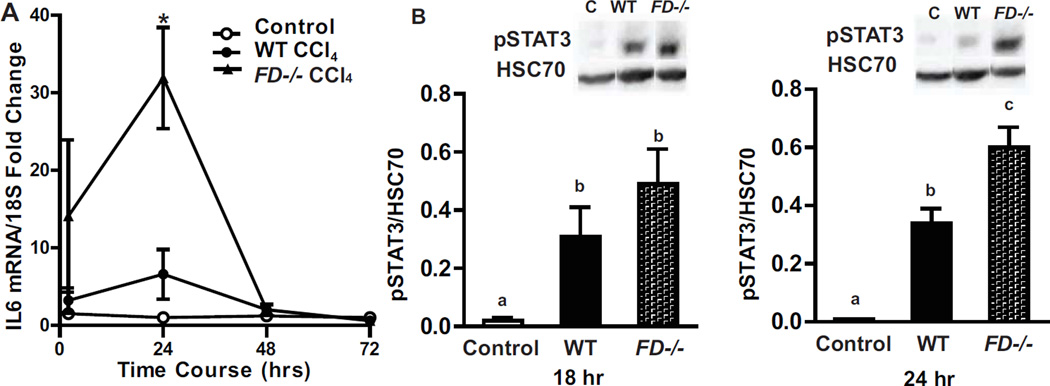
Figure 6. IL-6 and pSTAT3 were increased in FD−/− mice 24 hr after CCl4 exposure.
Expression of IL-6 mRNA and phosphorylated STAT3 was detected in mouse livers at after a single injection of CCl4. A. IL-6 mRNA was detected in WT and FD−/− mice 2, 24, 48 and 72 hr following a CCl4 challenge. B. Liver lysates of total hepatic protein were prepared and levels of phosphorylated (Tyr705)-STAT3 was detected 18 and 24 hr following a single injection of CCl4. Quantification of band intensity measured by densitometry after normalization to HSC70 are shown in the bar graphs. n = 4–6 mice per group. Bars are means ± SEM. Values with different alphabetical superscripts or points represented by an (*) are significantly different from each other, p<.05.

