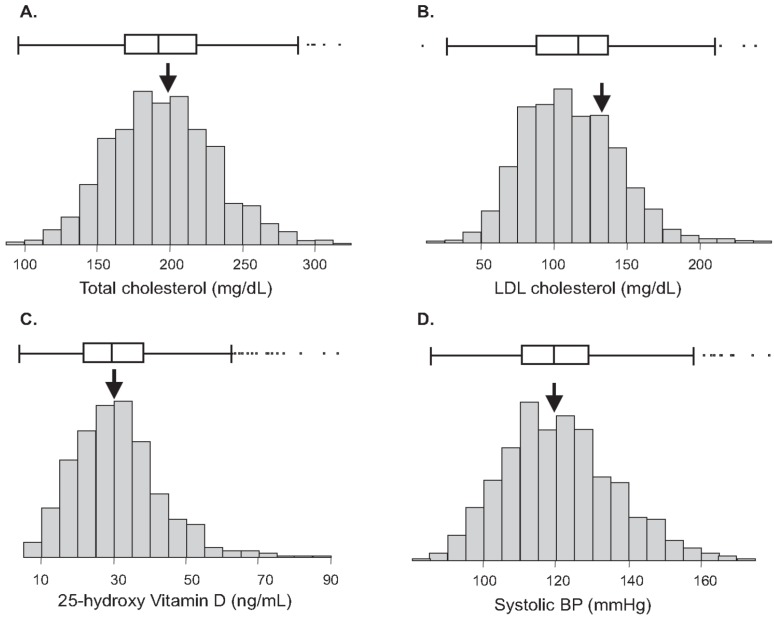
Figure 1.
Distribution of cardiovascular risk factors in The Center for Health Discovery and Wellbeing (CHDWB) cohort at baseline. Arrows indicate reference mean for US population at large. Box and whisker show 1 and 2 standard deviations from the mean. Frequency distribution histograms are for (A) Total cholesterol, (B) LDL cholesterol, (C) Vitamin D, and (D) systolic blood pressure.

