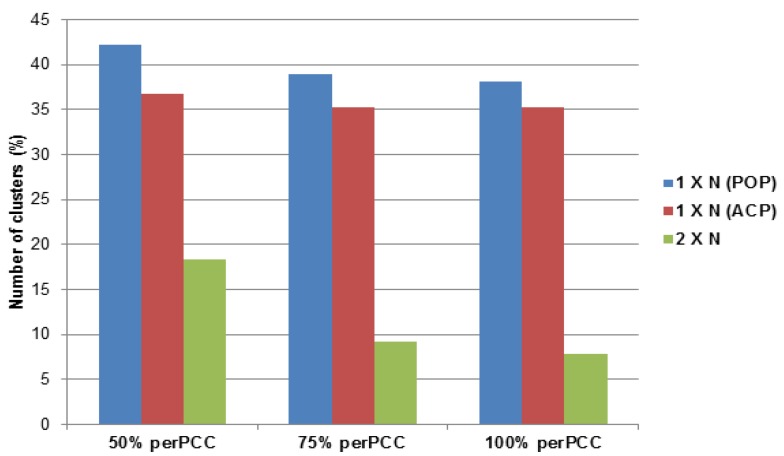
Figure 7.
Analysis of OrthoMCL multicopy cluster member expression. Expression (i.e., RPKM-reads per kilobase per million) values of each sequence pair in a cluster were compared for their Pearson Correlation Coefficient (PCC). Graph shows percent of pairs per cluster with PCC values ≥ 0.8 (y-axis) versus percentage of total number of clusters in the category (x-axis). Single taxon groups (1 × N) contained more clusters of uniformly expressed contigs (≥50% perPCC in comparison to two-taxon groups (2 × N).

