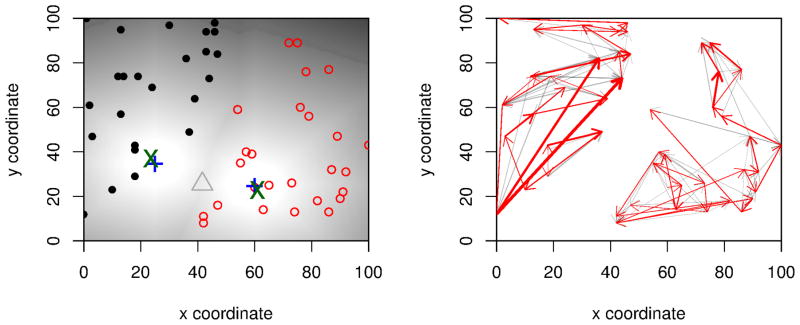
Figure 8. Detecting multiple origins.

Panel a: We simulated two expansions that originated at the same time from origins indicated by the blue crosses. The color gradient in the background corresponds to the time of colonization time of each deme. We address the problem of inferring the origin of multiple expansions using a two-step procedure. First, we cluster the samples into discrete clusters (red and black circles, respectively) and then estimate the expansion signal and origins independently for the clusters, resulting in high accuracy for both estimated origins (green X) when compared to the actual origins (blue +). The grey triangle denotes the estimated single origin if we did not do the two step procedure; it lies approximately half way between the two actual origins. The right panel shows the inferred migration patterns after a transitive reduction (grey/red arrows) and a maximum spanning tree (red arrows).
