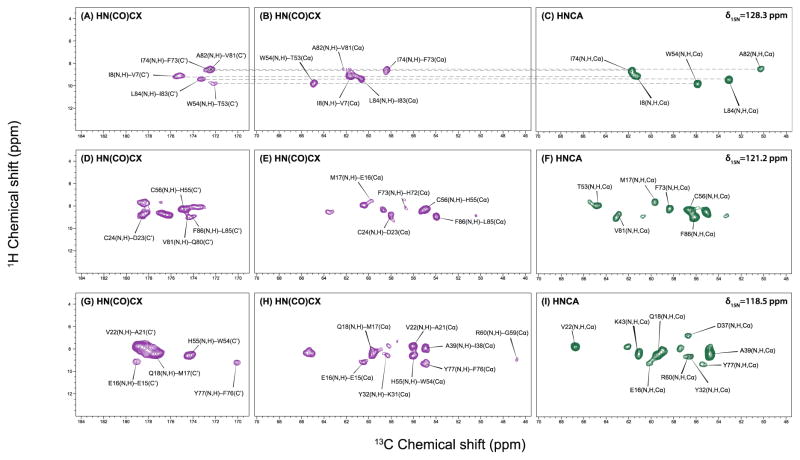
Figure 3.
Representative 2D H–C planes of the 13C-detected 3D HNCOCX (purple) and HNCA (green) spectrum of U–13C,15N-LC8 at (A–C) δ15N = 128.3 ppm; (D–F) δ15N = 120.8 ppm; (G–I) δ15N = 118.1 ppm. The correlations between amide proton and Cα of the same residue (i) or Cα of the previous residue (i-1) clearly reveal the connectivity of adjacent amino acids (shown as dashed line in Figure 3. A–C). All the spectra were acquired at the magnetic field of 19.9 T (850 MHz 1H frequency) and MAS frequency of 62 kHz. The experimental times are 3.5 days for HNCA, 1.5 days for HNCO and 7 days for HNCOCX.

