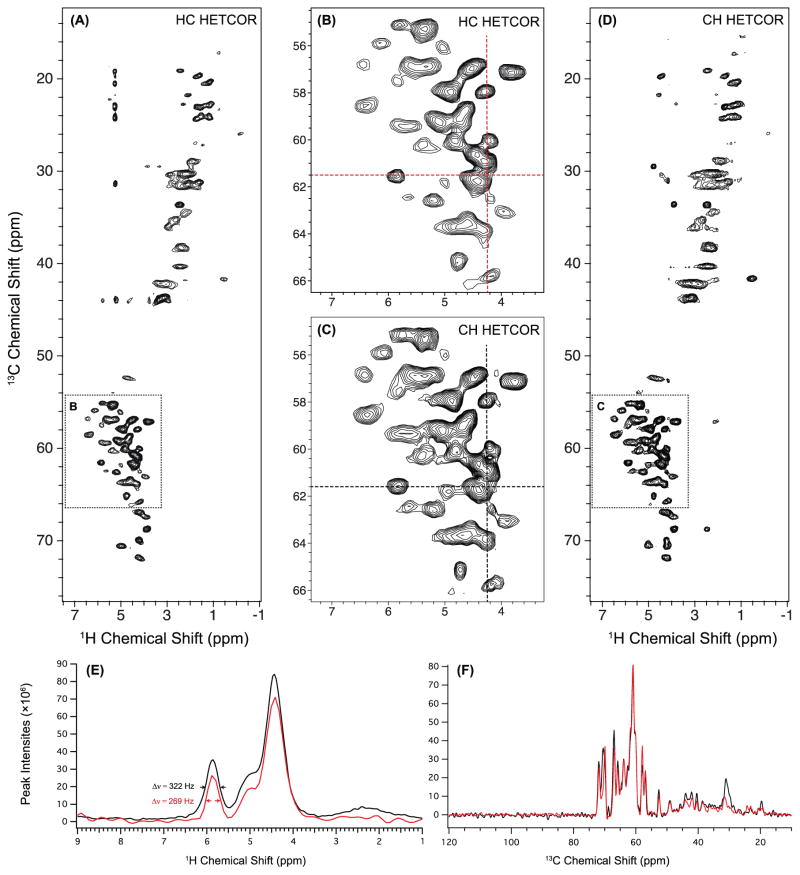
Figure 6.
2D H–C 13C-detected HETCOR spectrum (A) and 2D C–H 1H-detected HETCOR spectrum (D) of U–13C,15N-LC8 acquired at 60 kHz MAS and 850 MHz. Both spectra were processed with 30-degree sine bell apodization. The lowest contour level is set at 10 × σ RMSD with multiplier of 1.2. The zoom-in representations of the 1HN-13Cα region of each HETCOR spectrum are displayed in B and C. The experimental time was the same in both cases (4.5 hours) while different numbers of scans were used: 128 scans for HC HETCOR and 32 scans for CH HETCOR. Note that several cross peaks that appear in the 1H-detected HETCOR are not visible in 13C-detected experiment, because of the lower sensitivity of the latter. The peaks in the 13C-detected HETCOR that appear around δ13C = 20–45 ppm/δ1H = 5.2 ppm (1H) are most likely artifacts. 1D slices were extracted from 2D HETCOR spectra processed with 60-degree sine bell at the position of crosshairs shown in B and C: (E) 1H slices of HC HETCOR (red) and CH HETCOR (black) extracted at δ13C = 61.5 ppm. The 1H linewidth of the peak at δ1H = 5.9 ppm is 269 Hz for 13C-detected HETCOR and 322 Hz for 1H-detected HETCOR. F) 13C slices of HC HETCOR (red) and CH HETCOR (black) extracted at δ1H = 4.25 ppm.

