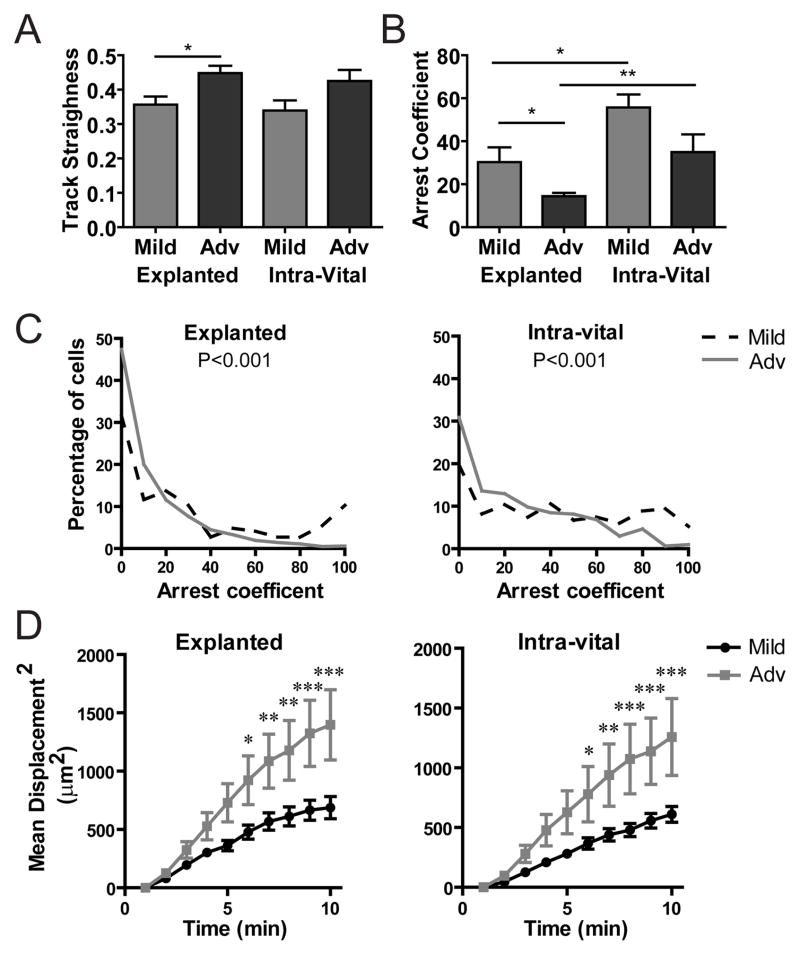
Figure 4. T cells reduce arrest and increase displacement as islet infiltration progresses.
Activated BDC-2.5 T cells were fluorescently labeled and transferred 24 hours prior to imaging as in Figure 3. Data were pooled from 16 explanted islets from 4 mice in 3 independent experiments and 16 intra-vital islets from 7 mice in 7 independent experiments. *= P<0.05, **= P<0.01, ***= P<0.001; measured by 2-way Anova with Bonferroni posttests or Student’s t test. A–B) Average of individual islets. A) T cell track straightness (1= cell moves in a straight line). B–C) T cell arrest coefficient (% of time crawling speed is <2μm/min). D) Mean squared displacement (μm2) over time.

