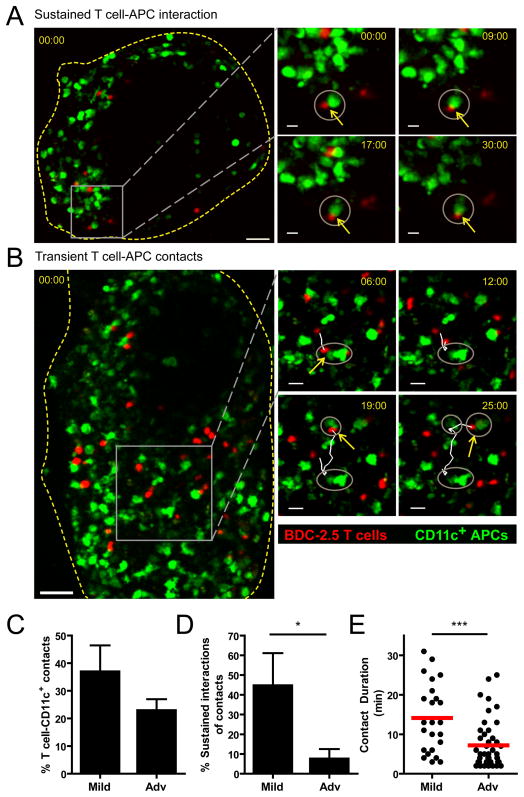
Figure 6. Sustained T cell-CD11c+ APC interactions are lost with progression of islet infiltration.
Fluorescently labeled BDC-2.5 T cells were transferred into CD11c-YFP hosts 24 hours prior to islet isolation and imaging. Data represent 15 islets from 5 mice in 5 independent experiments. ***= P<0.001 by two-tailed Student’s t test. A–B) Maximum intensity projection images showing BDC-2.5 (red) and CD11c+ APCs (green) within pancreatic islets. Yellow box indicates the region shown in time-lapse images on the right. Grey circles highlight the CD11c+ APCs that the T cell of interest has contacted; yellow arrows show current T cell-APC contacts. Time stamps= min:sec. A) Sustained T cell-APC interaction in an islet with mild infiltration. Scale bar= 40μm for whole islet and 10μm for time-lapse images. B) Transient T cell contacts with different CD11c+ APCs in an islet with advanced infiltration. Scale bar= 50μm for whole islet and 20μm for time-lapse images. C) Average percentage of T cells within individual islets that contact CD11c+ APCs for at least 2 min. D) Average percentage of T cells that contacted CD11c+ APCs, which had sustained interactions of ≥ 10 min. E) Duration of T cell- CD11c+ APC contacts.

