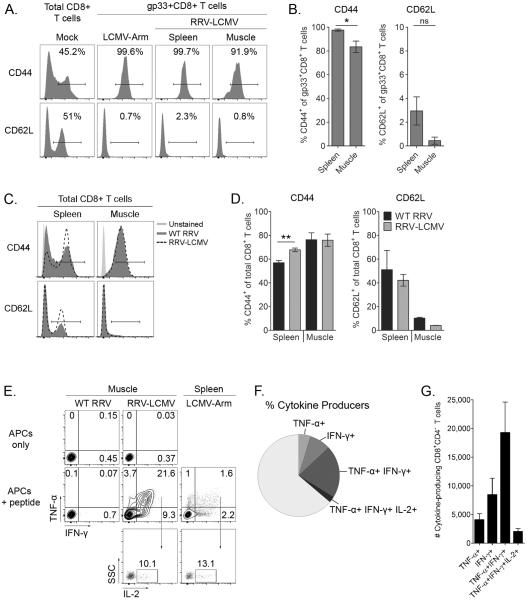
Figure 4. Virus-specific CD8+ T cells from the spleen and muscle tissues of RRV-LCMV-infected mice express different levels of activation markers and produce cytokines following ex vivo restimulation.
(A and B) Three-to-four week-old C57BL/6J mice were mock-inoculated (n = 3) or inoculated with 103 PFU of RRV-LCMV (n = 9). At 10 dpi, leukocytes were isolated from spleens and quadriceps muscles (following enzymatic digestion) for FACS analysis. Spleen cells from a mock-inoculated mouse and a mouse inoculated with LCMV-Armstrong i.p. and harvested on day 7 pi was used as a control for gp33 tetramer staining. (A) Representative histogram plots showing CD44 and CD62L staining on T cells. (B) Frequency of activation marker-positive T cells in spleen compared to muscle tissue from RRV-LCMV-inoculated mice. Data are combined from two independent experiments. Graphs represent the arithmetic mean ± SEM. * P > 0.05, ** P < 0.01, as determined by two-tailed, unpaired t-test with or without Welch's correction. (C and D) Three-to-four week-old C57BL/6J mice were or inoculated with 103 PFU of WT RRV (n = 4) or RRV-LCMV (n = 9). At 10 dpi, leukocytes were isolated from spleens and quadriceps muscles (following enzymatic digestion) for FACS analysis. (C) Representative histogram plots showing CD44 and CD62L staining on total CD8+ T cells from WT RRV- or RRV-LCMV-inoculated mice compared to unstained splenocytes. (D) Frequency of activation marker-positive T cells from the spleen or muscle tissue of WT RRV- or RRV-LCMV-inoculated mice. Data are combined from two independent experiments. Graphs represent the arithmetic mean ± SEM. ** P = 0.002, as determined by a two-way, unpaired t-test. (E–G) Three-to-four week-old C57BL/6J mice were inoculated with 103 PFU of WT RRV (n = 2) or RRV-LCMV (n = 5). At 10 dpi, infiltrating leukocytes were isolated from the quadriceps muscles (following enzymatic digestion) and restimulated ex vivo for 5 hours with gp33 peptide followed by intracellular cytokine staining. Spleen cells from a mouse inoculated with LCMV-Arm i.p. and harvested on day 7 pi was used as a control for gp33 peptide restimulation. (E) Representative flow plots showing IFN-γ, TNF-α, and IL-2 production by CD8+CD4− T cells following stimulation with antigen presenting cells (APCs) alone (top panel) or APCs with peptide (middle and bottom panels). (F) Graph showing the distribution of zero, one, two, or three-cytokine-producing CD8+CD4− T cells isolated from quadriceps muscle tissue of RRV-LCMV-inoculated mice at 10 dpi. (G) Total number of one, two, or three-cytokine-producing CD8+CD4− T cells. Graphs represent the arithmetic mean ± SEM.

