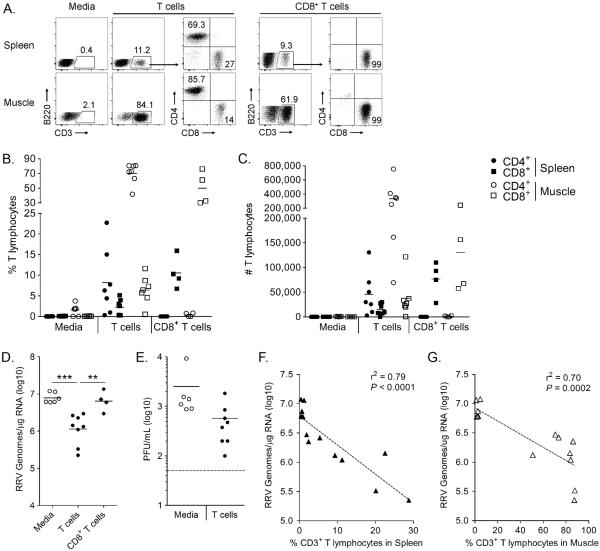
Figure 7. T cells contribute to the control of RRV infection in the absence of B cells and Ab.
Pan T cells were negatively selected from the spleen of WT mice, and 2.5 × 10⁶ cells were injected i.p. into Rag1−/− mice (n = 8) one day prior to RRV inoculation. Alternatively, CD8+ T cells were negatively selected from the spleen of WT mice, and 1 × 10⁶ cells were injected i.p. into Rag1−/− mice (n = 4) one day prior to RRV inoculation. As a negative control, 6 Rag1−/− mice received media alone on day −1. Spleens and left quadriceps were harvested at 14 dpi for flow cytometric analysis of the presence of T cells, as shown in (A). Cells were gated on Gr-1−B220−, then CD3+, then divided into CD4+ or CD8+. The percent of CD3+CD8+ T cells (squares) and CD3+CD4+ T cells (circles) in the spleen (closed shapes) and muscle (open shapes) are graphed in (B), and the total number of CD3+CD8+ T cells and CD3+CD4+ T cells in the spleen and muscle are graphed in (C). Right quadriceps (D) and right ankle/foot (not shown) were harvested for analysis of RRV RNA. Horizontal bar indicates the mean. ** P < 0.01, *** P < 0.001, as determined by one-way ANOVA followed by Tukey's multiple comparison test. (E) Serum viremia levels measured by direct plaque assay on BHK-21 cells. Dashed line indicates the limit of detection. (F) The percent of CD3+ T cells (gated on Gr-1−B220− cells) in the spleen plotted against the corresponding RRV RNA level in the quadriceps muscle at 14 dpi. Linear regression analysis was performed to determine the r2 values and P-values. Data are combined from four independent experiments.

