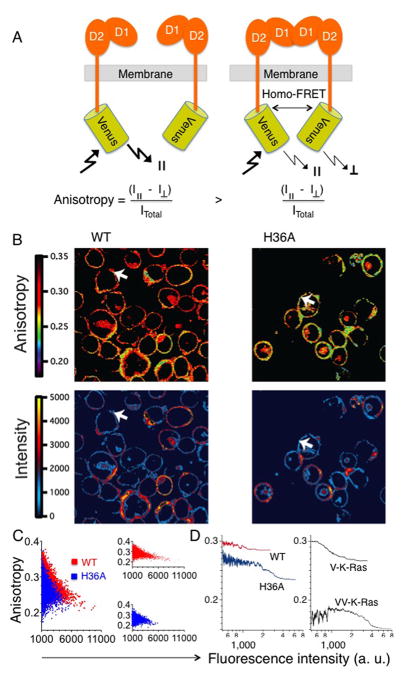
FIGURE 7.
Self-association of 2DL1-WT and 2DL1-H36A monitored by anisotropy measurements. (A) Diagram depicting how receptor self-association generates homo-FRET and a reduced fluorescence anisotropy. In the absence of homo-FRET, the emission of Venus is detected mostly in the parallel plane (||) of polarization. If homo-FRET occurs between two Venus molecules in close proximity, the emission will become more evenly distributed between both parallel and perpendicular (⊥) planes of polarization, and anisotropy will drop. (B) Anisotropy (top) and fluorescence intensity (bottom) images of YTS-2DL1-WT-Venus and YTS-2DL1-H36A-Venus cells. White arrows show YTS-2DL1-WT-Venus and YTS-2DL1-H36A-Venus cells with matched fluorescence intensity (expression level), but distinct anisotropy values. (C) Quantitation of anisotropy and fluorescence intensity of YTS-2DL1-WT-Venus (red) and YTS-2DL1-H36A-Venus (blue) cells shown in panel B. Individual pixel anisotropy values are plotted parametrically as a function of fluorescence intensity. Quantitation was performed using the software IGOR Pro (WaveMetrics). Right panel shows the same data potted separately for YTS-2DL1-WT-Venus (red) and YTS-2DL1-H36A-Venus (blue) cells. (D) Median pixel anisotropy values (n = 350) are plotted as a function of fluorescence intensity. The left panel shows YTS-2DL1-WT-Venus (red) and YTS-2DL1-H36A-Venus (blue) cells. In the right panel, anisotropy of membrane tethered Venus monomer (V-K-Ras) and Venus dimer (VV-K-Ras) is shown. The median pixel anisotropy values were determined from three independent images.

