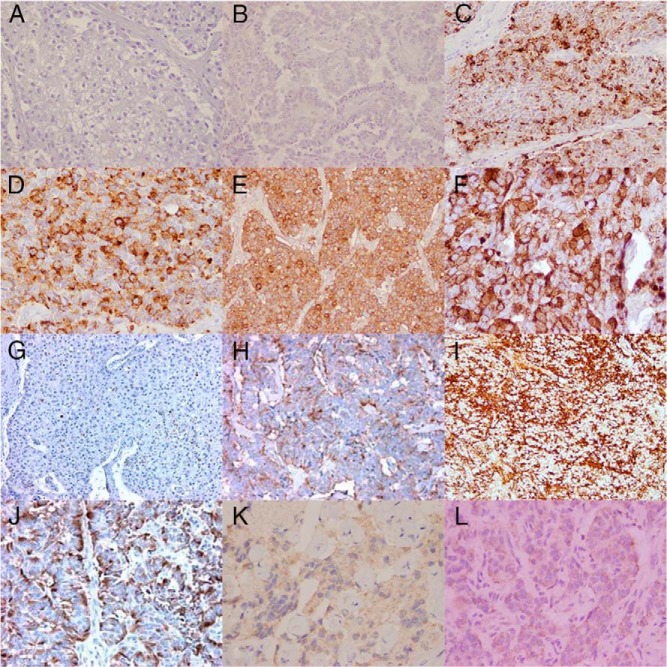
Figure 4.
A, B, C, E, NET with ACTH staining from patients 1, 2, 3, and 5 respectively (magnification, ×20); D, F, ACTH staining from patients 3 and 6 respectively (magnification, ×40); G–J, CRH staining from patients 1–4 respectively (magnification, ×20); K, bronchogenic carcinoid tumor with CRH staining from patient 5 (magnification, ×40); L, thymic carcinoid tumor with CRH staining from patient 6 (magnification, ×60).

