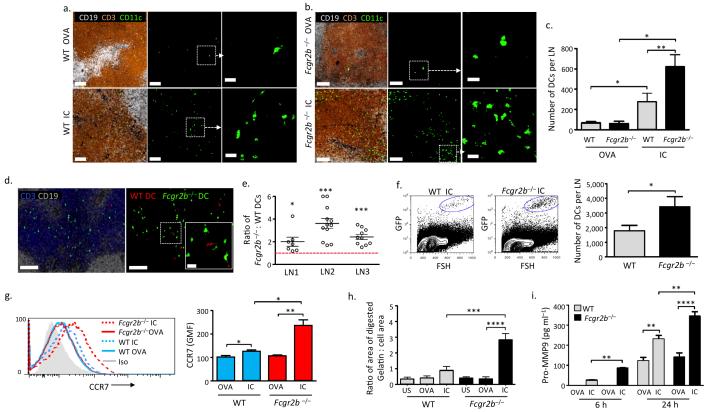
Figure 1. Immune complexes increase CCR7 expression, matrix metalloprotease production, and migration of murine bone marrow-derived DCs.
Representative images of a draining lymph node 48 hours following subcutaneous transfer of bone marrow-derived DCs (BMDCs) (green) from WT (a) or Fcgr2b−/− (b) mice incubated with ovalbumin (OVA, upper panels) or IgG-opsonised ovalbumin (IC, lower panels) for 24 hours prior to transfer. B cell follicles shown in white (CD19) and T cells (CD3) in brown. Scale bars in left and middle panels = 80 μm. Right panels show high power image (scale bars = 20 μm). (c) Total number of WT and Fcgr2b−/− DCs per lymph node 48 hours following transfer, as enumerated from serial 50μm sections. Graph shows mean and standard error of mean (SEM). (d) Representative images of draining lymph node 48 hours following the transfer of BMDCs from WT (red) and Fcgr2b−/− (green) mice stimulated for 24 hours with IC. B cell stained with CD19 (white) and T cells with CD3 (blue). Scale bar = 100μm. Inset shows high power image of area outlined by white square (scale bar = 20μm). (e) Ratio of Fcgr2b−/− to WT IC-stimulated BMDCs in the paracortex of three lymph nodes (LN) 48 hours following subcutaneous transfer. Each point represents the ratio observed in a 50μm section. Bars show mean and standard error of mean. Red dashed line marks a ratio of 1 (value of equivalent DC migration). (f) Representative flow cytometric data from dissociated lymph nodes 48 hours following transfer of GFP+ mouse BMDCs. IC-stimulated WT BMDCs are shown in left panel and Fcgr2b−/− BMDCs in the middle panel. Right panel shows quantification of lymph node BMDCs by flow cytometry 48 hours following transfer (Mean and SEM from 7 lymph nodes from 4 mice in each group). (g) Representative histograms of CCR7 expression on WT (blue lines) and Fcgr2b−/− (red lines) BMDCs following 24 hours of incubation with OVA (solid lines) or IC (dotted lines) (left panel) and geometric mean fluorescence (GMF) of CCR7 staining in WT and Fcgr2b−/− BMDCs (right panel). (h) Gelatinase production as quantified by area of FITC-gelatin digested over 24 hours by DCs following FcγR cross-linking with IC. Graph shows mean and SEM values obtained from combined result of three separate experiments. (i) MMP-9 levels in culture supernatants obtained from WT and Fcgr2b−/− BMDCs 6 and 24 hours following incubation with OVA or IC. Graph shows mean and SEM of triplicates from representative experiment of three repeats. P values calculated using a Student’s t test (two-tailed). * = P ≤ 0.05, ** = P ≤ 0.01, *** = P ≤ 0.001, **** = P ≤ 0.0001.

