
Figure 2.
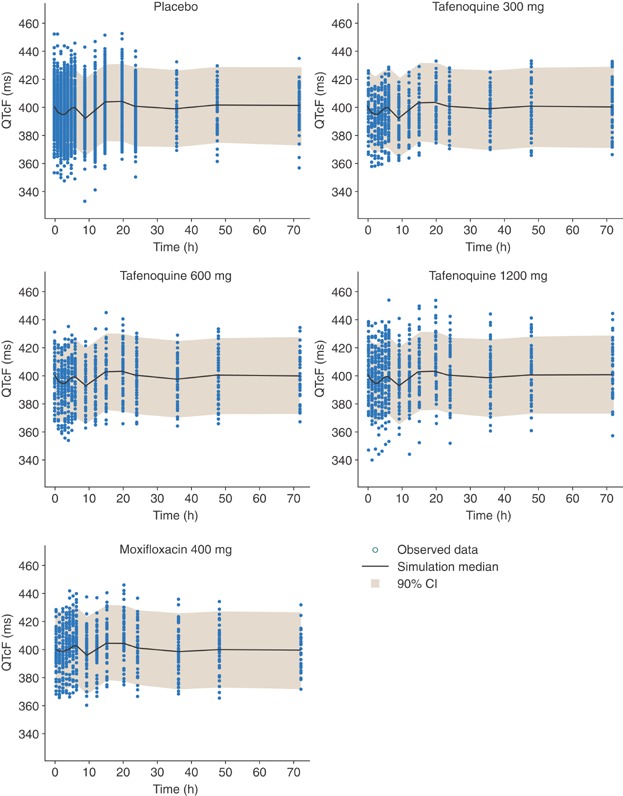
Visual predictive check for QTcF interval (milliseconds) versus time profiles following administration of placebo, 300, 600, and 1200 mg tafenoquine, and 400 mg moxifloxacin. The shaded area indicates the 90% prediction intervals of the simulated QTcF values.