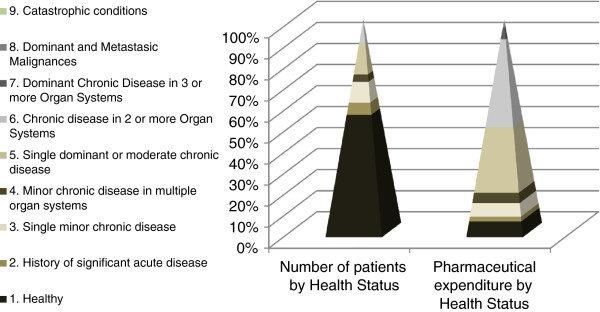
Figure 1.

Stratification of patients by core health status and pharmaceutical expenditure in 2012. Shows a graph for the number of patients, classified into each of the nine CRG core health statuses, and the average cost in this period. In the graph for this data it can be clearly seen how each strata of the population is related to the pharmaceutical expenditure.
