Figure 3.

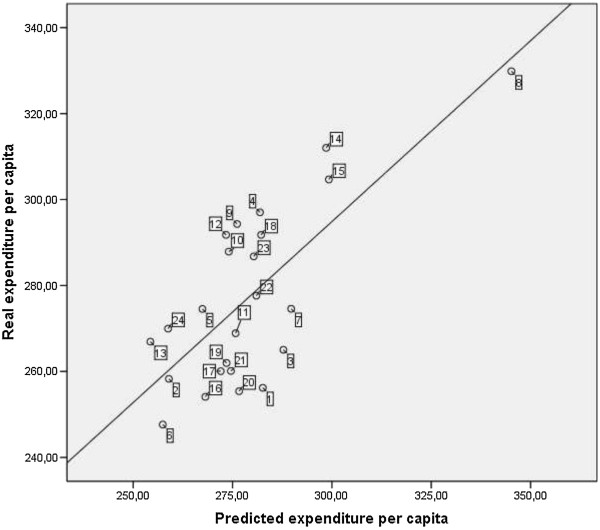
Pharmaceutical expenditure real and predicted by health district 2013. Shows a scatter plot to display values for real (y axis) and predicted (x axis) pharmaceutical expenditure of each heath district.

Pharmaceutical expenditure real and predicted by health district 2013. Shows a scatter plot to display values for real (y axis) and predicted (x axis) pharmaceutical expenditure of each heath district.