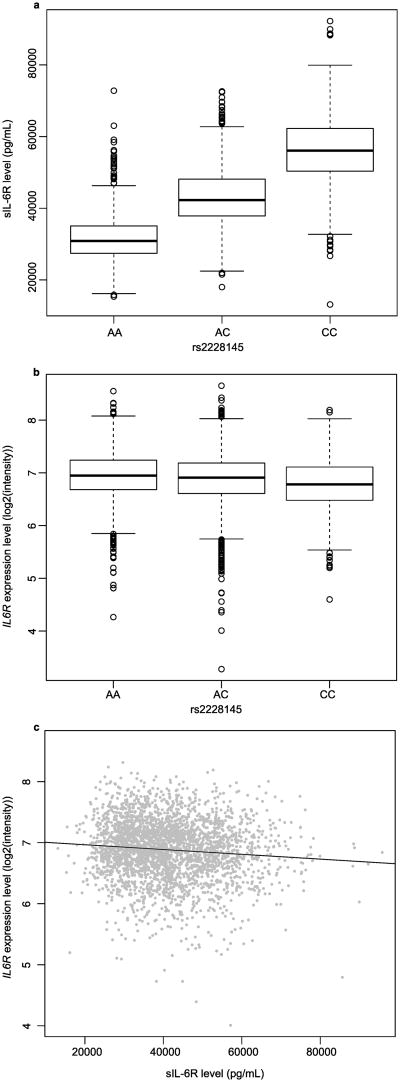
Figure 1. Associations between sIL-6R level, IL6R expression and rs2228145 genotype.
A: Boxplots of plasma sIL-6R level (pg/mL) for each rs2228145 genotype. B: Boxplots of IL6R expression level in blood as measured by expression probe 582_132 for each rs2228145 genotype (P = 3.14 × 10⁻¹⁹). C: Scatterplot of sIL-6R level (pg/mL) versus IL6R expression level for probe 582_132 (r = -0.092, P = 1.42 × 10⁻⁶).

