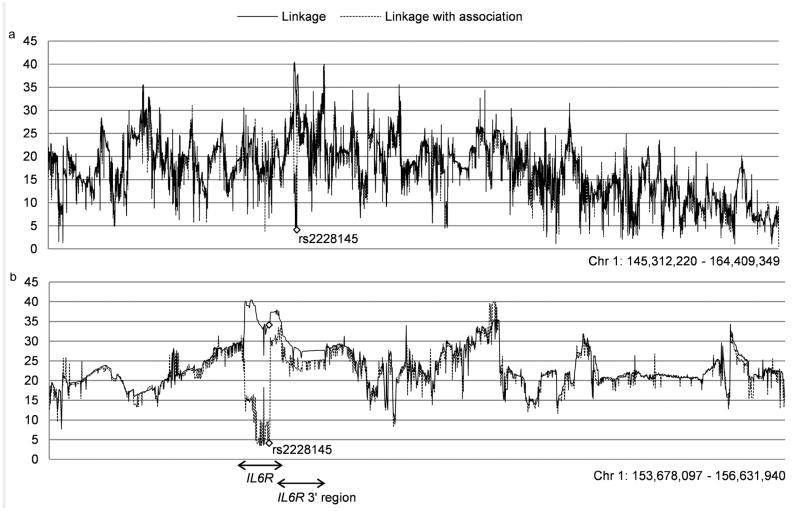
Figure 2. Results from combined linkage and association analysis of the IL6R region on chromosome 1.
The solid black line connects the X2 values from the linkage test at each SNP without modeling SNP association and the dotted black line connects the X2 values from the linkage test at each SNP when association is simultaneously modeled. The analysis was performed for all imputed SNPs with a MAF > 0.2 in IL6R +/-10MB, chr1 (build 37): 145312220-164409349 (x-axis, Figure A). Figure B zooms in to the region from basepair position 153678097 to 156631940. The arrows mark the location of the IL6R gene, and the location of an LD block stretching across the 3′UTR of IL6R and adjacent genes SHE and TDRD10, where significant hits were found in the eQTL analysis for SNPs in partial LD with rs2228145 (r2 ∼0.1).

