Figure 1.

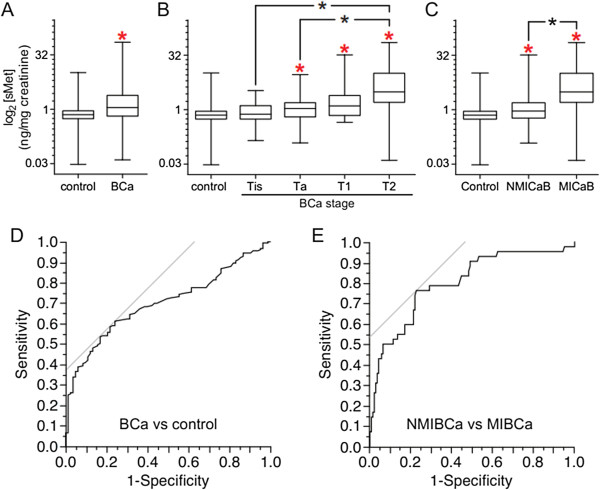
Comparison of urinary sMet levels among BCa patients and controls. A. Box and whisker plot of urine sMet/creatinine values (ng sMet/mg creatinine) for control patients with no evidence of BCa (n = 83) and patients with pathology proven BCa (n = 183). Red asterisk indicates significant difference in median value from control (Mann–Whitney test with Bonferroni multiple test correction). B. Box and whisker plots of urine sMet/creatinine values (ng sMet/mg creatinine) for control patients with no evidence of BCa and patients with BCa subdivided by pathologic stage. N for each group are listed in Table 1. Red asterisks indicate significant difference in median value from control; black asterisks indicate significant differences among medians as indicated by brackets (Mann–Whitney test with Bonferroni multiple test correction). C. Box and whisker plot of urine sMet/creatinine values (ng sMet/mg creatinine) for control patients with no evidence of BCa (n = 83), patients with NMIBCa (n = 141) or with MIBCa (n = 42). Red asterisks indicate significant difference in median value from control; black asterisk indicates significant differences among medians as indicated by brackets (Mann–Whitney test with Bonferroni multiple test correction). D. ROC curve of urine sMet/creatinine values (ng sMet/mg creatinine) for control patients with no evidence of BCa (n = 83) and patients with pathology proven BCa (n = 183). E. ROC curve of urine sMet/creatinine values (ng sMet/mg creatinine) for patients with NMIBCa (n = 141) or with MIBCa (n = 42). Criterion values balancing sensitivity and specificity are indicated by the gray lines tangent to the ROC curves.
