Figure 1.

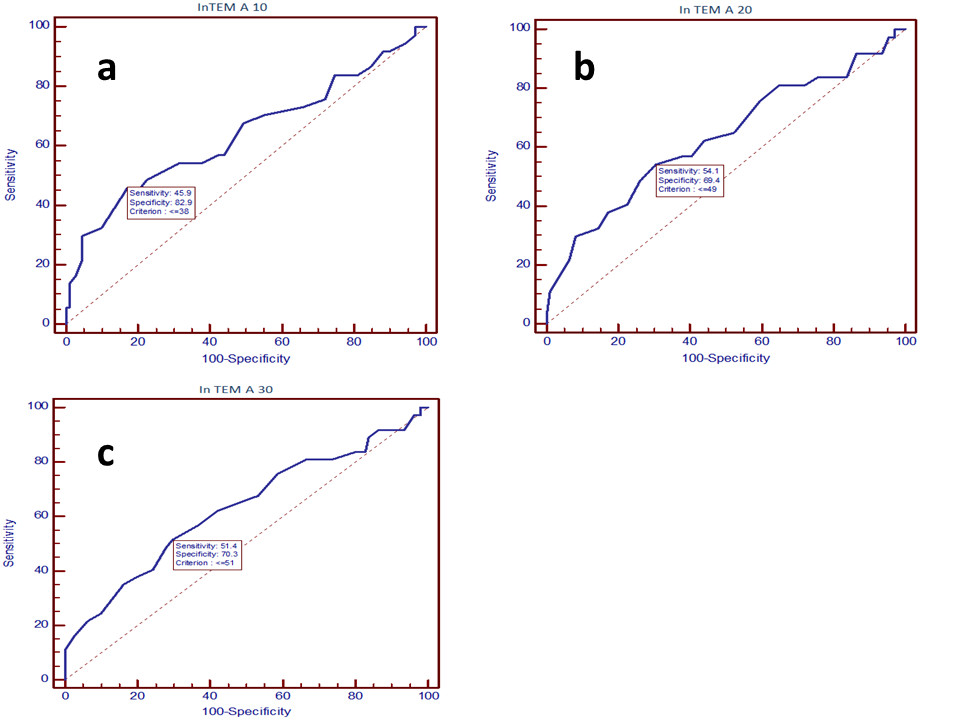
Receiver operating curve analysis for excessive bleeding prediction using (a) InTEM A 10 test (AUC 0.636, p = 0.02) , (b) InTEM A 20 test (AUC 0.632, p = 0.02) and by (c) InTEM A 30 test (AUC 0.630, p = 0.02).

Receiver operating curve analysis for excessive bleeding prediction using (a) InTEM A 10 test (AUC 0.636, p = 0.02) , (b) InTEM A 20 test (AUC 0.632, p = 0.02) and by (c) InTEM A 30 test (AUC 0.630, p = 0.02).